NVDIA - Given its size, it is not prudent to Gamble on a post earnings move. But if one really wants to then a Put Spread might be the most decent risk-reward option
Elliott Wave Analysis | NVDA CMP:147| Dt - 20th Nov'24
Simple speak
Options premiums are suggesting a ~7.3% move in NVDIA post earnings. This move is already factored into the option premiums. If you create a straddle, you will need a move of >7.3% in either direction to breakeven.
For a $3.6 Trillion company that is a $260Bn+ move. This is not any other stock now.
Looking at the NVIDIA chart, its channel, and our EW count, there are three possible scenarios if the results are favorable:
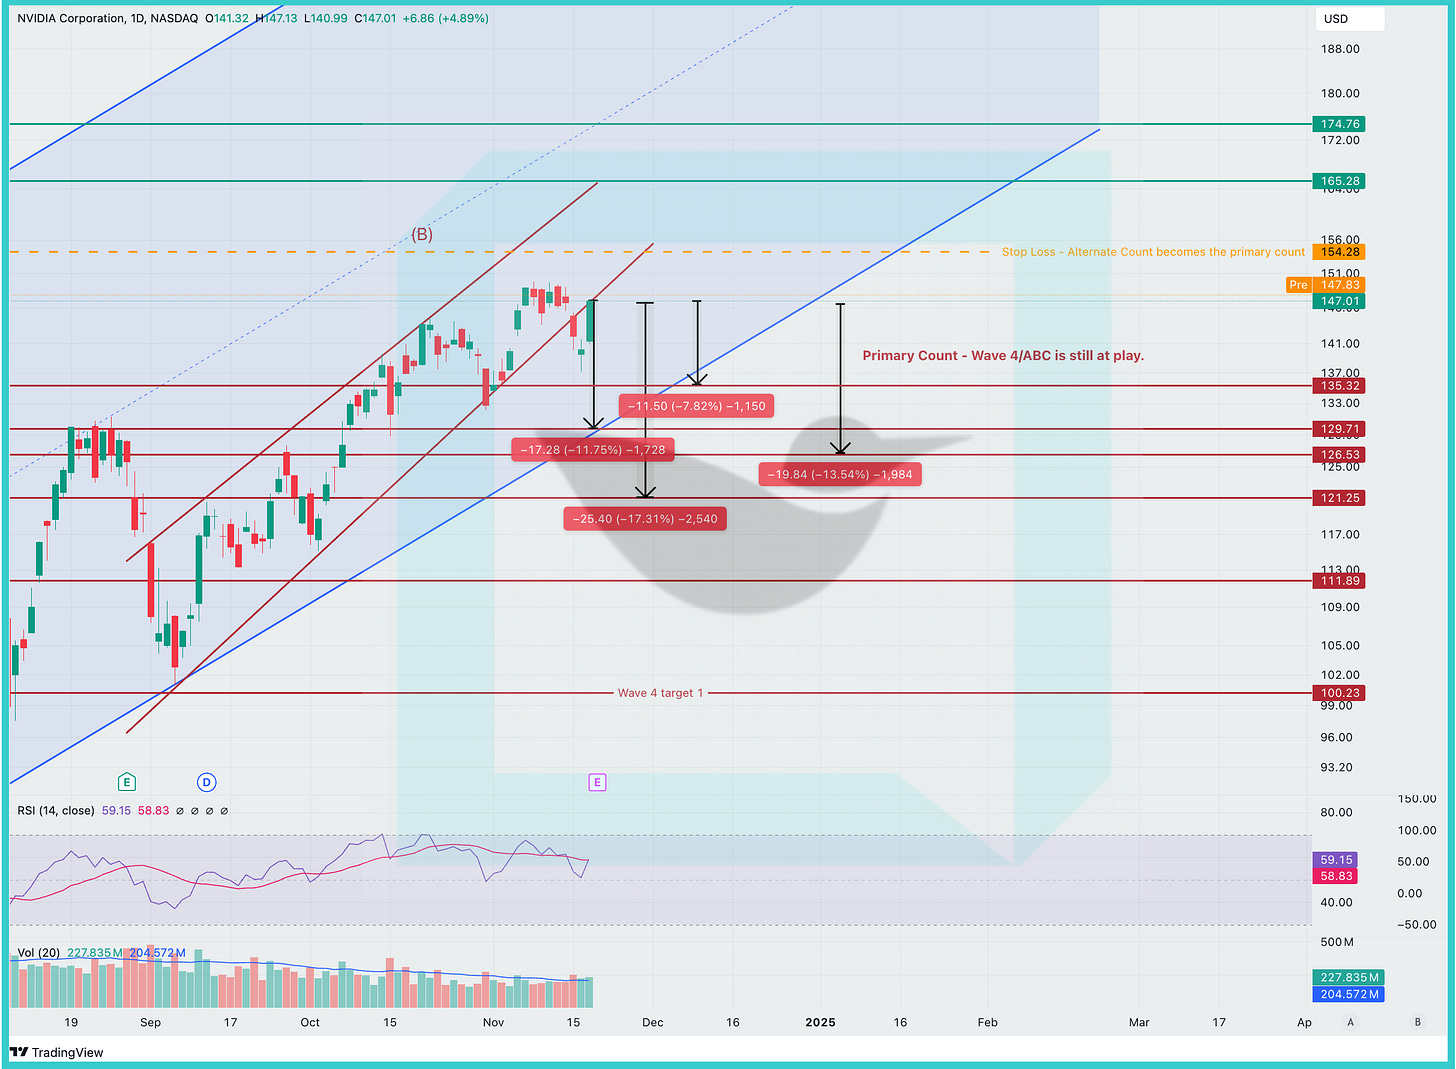
Wave B invalidation point acts as a resistance #1 - 5% gain
ABC count invalidates & it jumps higher
Channel top as as a resistance #2 - 12.3% gain
Long term channel mid point acts as resistance #3 - 18.6% gain
However if the results are not seen as great, the downside potential is significant as it could trigger the start of Wave C in the ABC correction. If the results are not favorable, the following scenarios are possible:
#1 - Results are muted & not as exciting, it retraces to a support level - 7.82% drop
#2 - Long term channel bottom acts as a support - 11.7% drop
#3 - Price breaks through the channel and finds support just outside - 13.5% drop
#4 - Earnings disappoint the market and it drops like a typical Wave C drop is and finds support significantly outside the channel - 17.31% drop
If we consider the first real support and resistance levels, the payoff for a bearish move appears more favorable. Additionally, if a bearish move results in a Wave C decline, the potential payoff could be massive. Based on the wave count, it is unlikely that a bullish outcome would offer a comparable payoff.
That said, betting against NVIDIA requires considerable courage, especially given the recent behavior of stocks like Tesla and Palantir in the past few days. If one were inclined to take such a gamble, a put spread might be a better alternative.
Chart speak
Earnings Beat - Bullish Move
Earnings Miss - Bearish Move
Previous Update
Elliott Wave Analysis | NVDA CMP: 146 | Dt - 14th Nov'24
Simple Speak
No change vs the last count
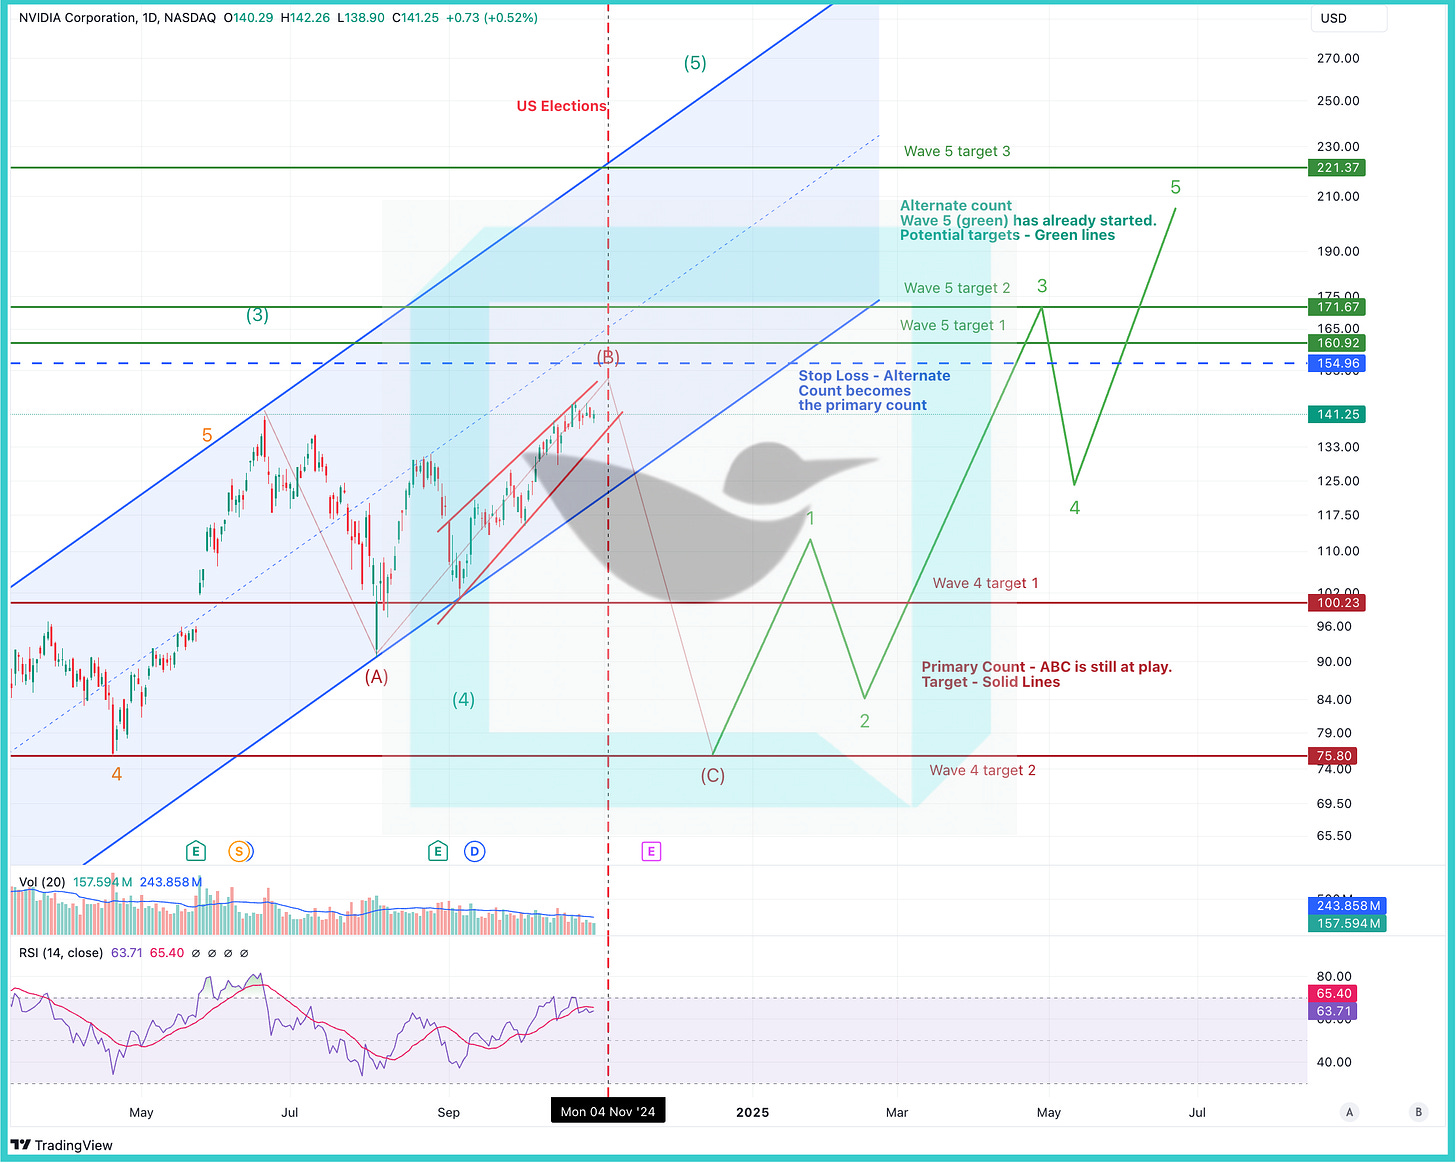
Primary count - Price should make a low before going higher in wave 5. Potential targets on the downside - $100-$75. Wave count is not super clear, this is the primary count at this point due to wave overlap and a potential diagonal formation.
Alternate count - Wave 5 is already underway and price should cross $160-$170 range without any major corrections. Price beyond $170 without any correction would make this the primary count
Chart Speak - Short Term
Previous update - 29th Oct
Elliott Wave Analysis | NVDA CMP: 141 | Dt - 29th Oct'24
Simple speak
NVDIA wave count is not super clear and at this point there are two possibilities. As per AlgoChirp, Primary count is still preferred given (1) overall RSI weakness/divergence and (2) Diagonal formation.
Primary count - Price should make a low before going higher in wave 5. Potential targets on the downside - $100-$75
Alternate count - Wave 5 is already underway and price should cross $160-$170 range without any major corrections.
Chart speak
Chart #1 - Zoom out
NVDA has experienced an extended Wave 3 advance and is currently in its Wave 4 corrective pattern. This pattern is likely to test further lows within the ongoing A-B-C correction. Once the current retracement concludes, NVDA should begin its final Wave 5 advance to new highs.
RSI divergence and the trendline indicate that the A-B-C correction is still in progress.
Chart #2 - Primary Count
Currently, Wave B of Wave 4 is in progress. According to this count, Wave C has yet to play out.
The ongoing Wave B appears to be forming a potential Ending Diagonal pattern.
If this wave count holds, the price should test the $100-$75 range in Wave C of Wave 4 before beginning the Wave 5 advance.
Since the price has already surpassed the all-time high from June 2024, we must remain open to an alternate count. If the price breaches $155 (our stop-loss for the current count), the odds will shift in favor of the alternate count.
Wave 4 targets are highlighted in Chart #2 below.
Chart #3 - Alternate Count
Another possibility is that the A-B-C correction concluded in August, and the Wave 5 advance has already begun, with Wave 3 of Wave 5 currently underway.
However, given that the current price action is forming an Ending Diagonal pattern, this count is less probable. It is very unusual to observe a diagonal pattern in a Wave 3 advance.
Targets for Wave 5 are highlighted in Chart #3.
Previous Update - 10/15
Key Highlights - EW Analysis by AlgoChirp
Primary Count - Weekly Chart below
Corrective Wave 4, is underway with Wave B in its final stages. This should be followed by Wave C and that should drag the prices down to April’24 lows.
Alternate count - However, if weekly RSI breaks the trend line or if price makes all time highs then it might imply that Wave 4 correction is already over and Wave 5 advance is already underway.
If this count becomes the primary count then potential Wave 5 price targets are shown in the charts below.


