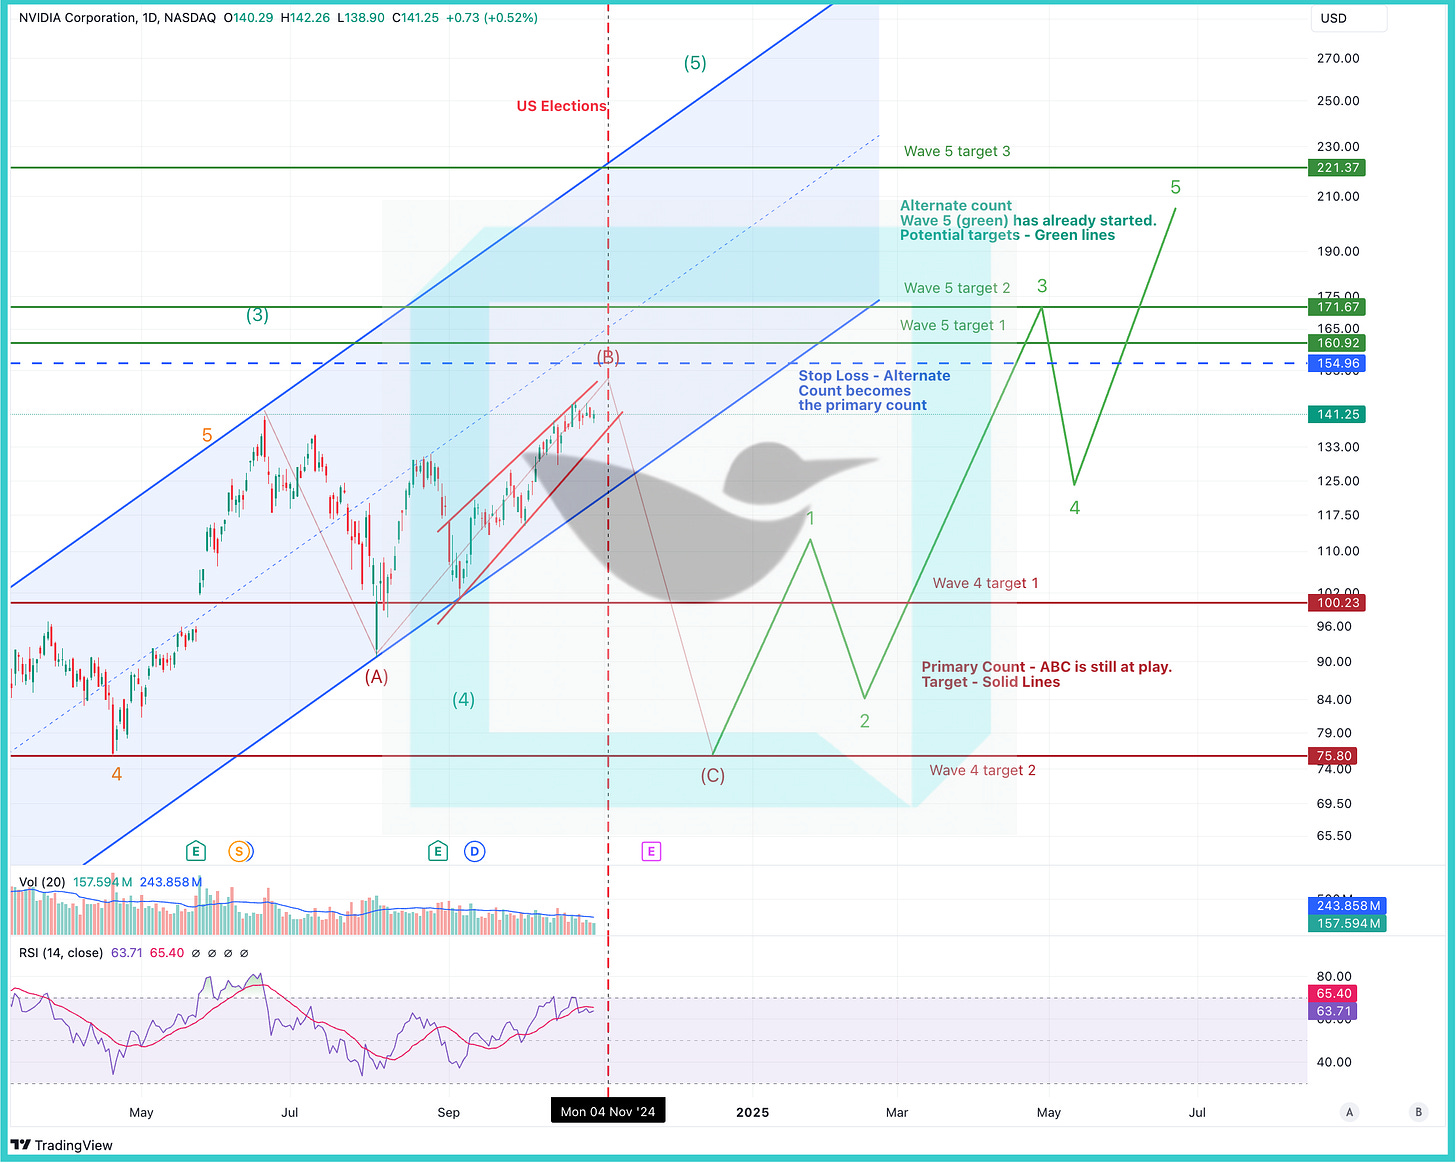
NVDIA - No change. EW still suggests a move lower ($100 or lower) before crossing $170+ in Wave 5 in 2025
Elliott Wave Analysis | NVDA CMP: 146 | Dt - 14th Nov'24
Simple Speak
No change vs the last count
Primary count - Price should make a low before going higher in wave 5. Potential targets on the downside - $100-$75. Wave count is not super clear, this is the primary count at this point due to wave overlap and a potential diagonal formation.
Alternate count - Wave 5 is already underway and price should cross $160-$170 range without any major corrections. Price beyond $170 without any correction would make this the primary count
Chart Speak - Short Term
Previous update - 29th Oct
Elliott Wave Analysis | NVDA CMP: 141 | Dt - 29th Oct'24
Simple speak
NVDIA wave count is not super clear and at this point there are two possibilities. As per AlgoChirp, Primary count is still preferred given (1) overall RSI weakness/divergence and (2) Diagonal formation.
Primary count - Price should make a low before going higher in wave 5. Potential targets on the downside - $100-$75
Alternate count - Wave 5 is already underway and price should cross $160-$170 range without any major corrections.
Chart speak
Chart #1 - Zoom out
NVDA has experienced an extended Wave 3 advance and is currently in its Wave 4 corrective pattern. This pattern is likely to test further lows within the ongoing A-B-C correction. Once the current retracement concludes, NVDA should begin its final Wave 5 advance to new highs.
RSI divergence and the trendline indicate that the A-B-C correction is still in progress.
Chart #2 - Primary Count
Currently, Wave B of Wave 4 is in progress. According to this count, Wave C has yet to play out.
The ongoing Wave B appears to be forming a potential Ending Diagonal pattern.
If this wave count holds, the price should test the $100-$75 range in Wave C of Wave 4 before beginning the Wave 5 advance.
Since the price has already surpassed the all-time high from June 2024, we must remain open to an alternate count. If the price breaches $155 (our stop-loss for the current count), the odds will shift in favor of the alternate count.
Wave 4 targets are highlighted in Chart #2 below.
Chart #3 - Alternate Count
Another possibility is that the A-B-C correction concluded in August, and the Wave 5 advance has already begun, with Wave 3 of Wave 5 currently underway.
However, given that the current price action is forming an Ending Diagonal pattern, this count is less probable. It is very unusual to observe a diagonal pattern in a Wave 3 advance.
Targets for Wave 5 are highlighted in Chart #3.
Previous Update - 10/15
Technical Analysis: Elliott Wave | NVDA CMP: 131.6 | Dt - 15th Oct'24
Tl;dr - NVDA, which has had an extended Wave 3 advance is currently in its Wave 4 corrective pattern. This pattern should see it test further lows in the ongoing A-B-C correction. Once the ongoing retracement ends, it should start its last Wave 5 advance to new highs.
Key Highlights - EW Analysis by AlgoChirp
Primary Count - Weekly Chart below
Corrective Wave 4, is underway with Wave B in its final stages. This should be followed by Wave C and that should drag the prices down to April’24 lows.
Alternate count - However, if weekly RSI breaks the trend line or if price makes all time highs then it might imply that Wave 4 correction is already over and Wave 5 advance is already underway.
If this count becomes the primary count then potential Wave 5 price targets are shown in the charts below.
Chart #1 - Weekly
Chart #2 - Daily
Analyst Rating vs EW count
Analyst rating suggests strong bullish outlook for Tesla. Per EW, short term projection is for price to make lower lows before heading higher.
Long Term - In sync with EW count
Short Term - Not in sync with EW count


