Tesla: We repeat - Euphoria never ends well. Odds for a correction are far greater vs for a material bullish move
Elliott Wave Analysis | Tesla CMP: 345 | Dt - 1st Dec'24
Simple Speak
Tesla will find it very difficult to go past the resistance band $343-$418. The odds for a reversal to commence Wave Z move are much higher. With this correction, the price should drop to $183 or below
Even though Tesla’s long term potential is good, new buyers should NOT jump in now. Wait for it to correct.
Chart Speak #1 - Long Term
Our long term view is still the same, Tesla is still in a Wave 4 holding/corrective pattern When the Wave 5 starts it will take it to massive new heights.
Chart Speak #2 & #3 - Mid Term
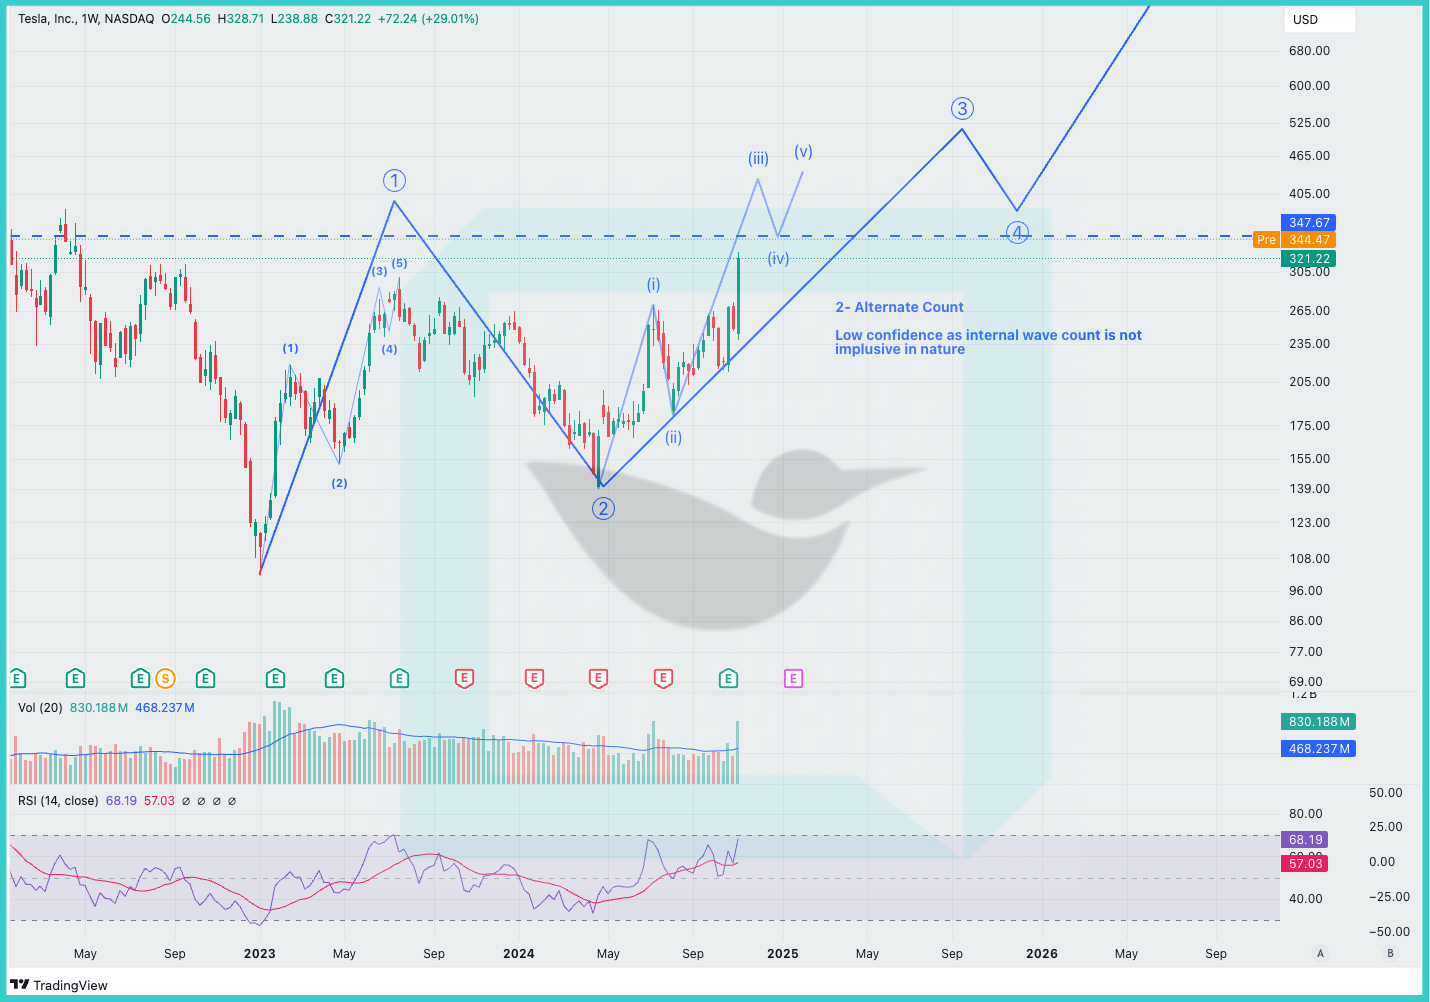
The ongoing Wave 4 has been a complex correction that has taken years to unfold, and we believe it is still incomplete. The current Wave X upward move is now within a resistance band that should be difficult to overcome.
If our wave count is correct, the price should drop to complete Wave Z before initiating an upward movement.
The primary reason we anticipate a short-term correction is that the current upward thrust (from May 2024 onwards) does not exhibit a clear 1-2-3-4-5 impulsive pattern and instead resembles a corrective A-B-C wave. If the price breaks above the resistance band, we will need to reassess and consider an alternative count. Until then, this remains our primary wave count.
Previous Update
Elliott Wave Analysis | Tesla CMP: 343 | Dt - 11th Nov'24
Simple Speak
Tesla’s recent price action is worrisome. Based on EW it is still in a corrective wave and this price action may not end well in the short term. See our view on Euphoria!
New buyers should NOT jump in now. Wait for it to correct.
Long term investors don’t need to worry. Opportunistic holders can look to take some profits.
Technical Analysis EW
Chart #1 - Long term Tesla still has a good runway and it should do well. However, for traders, which doesn’t look like a very attractive entry point.
Primary Wave Count (Chart #2) - Our view is that Tesla is still in a corrective wave, labeled WXYXZ in Chart #2. Area between 343 & 413 should offer resistance and act as a top for Wave X. I Wave Z, the price should turn lower with targets highlighted in red.
Recent price surge is unusual and can only explained as a bull trap to catch as many FOMO buyers as possible. We have spent time analysing Alternate possibilities but there aren’t many.
Alternate Count (Chart #3) - We are unable to clearly count internal waves and hence this wave count is of low confidence at this point. If price breaks above 413 then we will evaluate other possibilities.


