SPX: The primary count is still valid, but the pace at which it is unfolding raises questions about its downward potential.
Elliott Wave Analysis | SPX CMP: 5969 | Dt - 25th Nov'24
Simple Speak
Previous Update: A corrective wave should begin soon. Based on our estimates, SPX will find it very difficult to surpass the 6100-6150 range, if at all.
Where Do We Stand: The corrective wave began as predicted, with SPX dropping to 5850 before starting a retracement at a smaller degree (See: Chart #1). This retracement has extended much further than usual, with no clear signs of turning back down. The longer it takes for a vigorous third-wave drop to materialize, the less likely it becomes (See: Chart #2).
What if SPX Makes a New All-Time High?
Admittedly, this would slightly reduce the probability of our current primary count. However, considering the other available count options, we are still inclined to give our primary count some leeway.
If SPX breaks above 6000, it may indicate a flat correction, and we will adjust the target values for the next price drop accordingly.
That said, we continue to believe that SPX will struggle to cross the 6100-6150 range.
Chart Speak #1
Chart Speak #2
Previous Update
Elliott Wave Analysis | SPX CMP: 5984 | Dt - 13th Nov'24
Simple speak
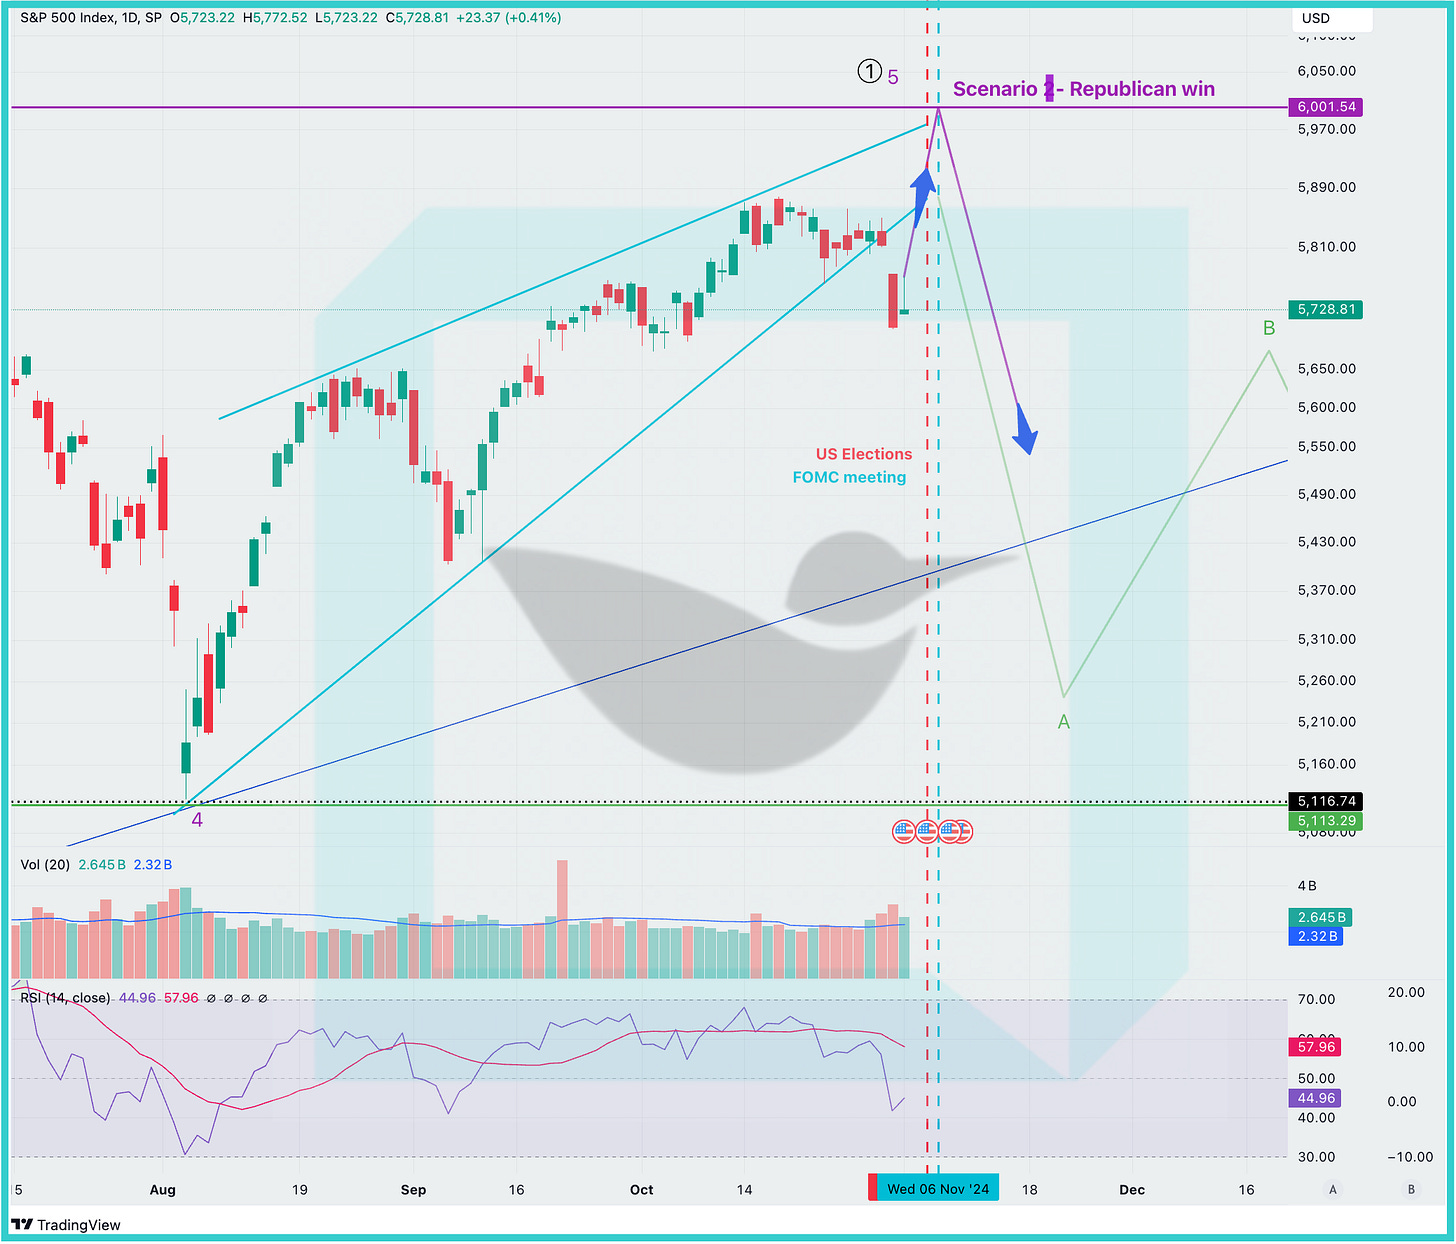
Our prediction regarding SPX touching 6K if Republicans win was spot on.
Next prediction is now for a corrective wave to begin soon. Based on our estimates, SPX will find it very difficult to go past 6100-6150, if at all.
Chart speak #1
Chart speak #2 (short term)
Previous update - 7th Nov’24
Elliott Wave Analysis | SPX CMP: 5929 | Dt - 7th Nov'24
Simple speak
Our prediction from the start of the week was
Speculation (#1) if Republicans Win
SPX rallies post-elections, reaching 6000(!) once again.
During the FOMC meeting, the Fed announces another rate cut, leading to a market sell-off and the beginning of an A-B-C correction.
It seems to be playing out like clockwork
Since Trump's win, stocks have rallied intensely, and 6000 for the SPX is now just 1.2% away
It is highly likely the SPX will touch 6000 today.
However, this is a critical juncture for the stock market. If the FOMC meeting causes markets to drop, it could mark the beginning of a significant decline.
According to Elliott Wave theory, the writing has been on the wall for a market Armageddon, with the Ending Diagonal pattern nearing its climax. If this decline doesn’t materialize by this week, or at the latest early next week, we may have to consider an alternate wave count.
Chart speak #1
Chart speak #2
Alternate count
Our confidence is still high for the primary count to play out. We will publish an Alternate count if it doesn’t break down by next week.
Previous update - 4th Nov’24
Elliott Wave Analysis | SPX CMP: 5728 | Dt - 4th Nov'24
Simple speak
Speculation (#1) if Republicans Win
SPX rallies post-elections, reaching 6000(!) once again.
During the FOMC meeting, the Fed announces another rate cut, leading to a market sell-off and the beginning of an A-B-C correction.
Speculation (#2) if Democrats Win
SPX remains muted, potentially retesting the ending diagonal trendline.
During the FOMC meeting, the Fed announces another rate cut, prompting a market decline and initiating an A-B-C correction.
Reason for this Speculation
We have anticipated a market downturn this week but were uncertain of the catalyst. It seems we may have identified a leading factor—bonds. The bond market is sending concerning signals, and the next rate cut may serve as a critical inflection point (e.g., see The Damped Spring Report).
There’s also growing chatter that a Trump win could benefit equities, at least in the short term.
Is Elliott Wave Supporting These Speculations?
Yes, both scenarios align with our original Elliott Wave count and our anticipated correction (which, for now, remains a prediction).
Speculation #1 has a stronger rationale:
The SPX chart has generally followed the Elliott Wave count, with one exception. It broke down before completing five waves, which may indicate a "Throw Over." Here, the recent break below could represent Wave 4, with an upcoming break above to 6000 as the Wave 5 top.
Speculation #2:
While the internal wave count is less clear, the overarching ending diagonal pattern remains evident, supporting this scenario as valid.
The long-term wave count is provided in the older posts linked below.
Chart speak - #1
Chart speak - #2
Previous update - 29th Oct’24
Tl;dr - Nothing new, SPX is headed for climax near the 6K region again. Charts are suggesting week of Nov 4th is going to be critical for a lot of stocks and the Index. Elliott Waves are known to predict direction of the price move in advance. Media finds reasons for those moves later. What will it be this time?
Simple speak
SPX chart has played out like we predicted in the last post. Intersection of 6000 and US elections date is acting like a magnet on the Charts (Blue Arrow on Chart #1)
Given the Ending Diagonal pattern, the odds are in favour of a correction. The question is, Why? What are markets expecting that would warrant a drop? Further action in Middle East? Losing candidate’s shenanigans?
Regardless, at this point it seems 6000 should be a big resistance for SPX and correction is on the cards.


