[2025 outlook] SPX: 2025 is not looking very good for stocks in general. ABC correction in Wave 2 should consume most of 2025 for Equities
Elliott Wave Analysis | SPX CMP: 5881 | Dt - 2nd Jan'25
2025 outlook
Simple Speak
Our primary count is unfolding as predicted—something we have reiterated multiple times since October 2024.
A corrective wave for the S&P 500 (SPX) should begin soon, potentially dragging prices lower by 20% or more. SPX will find it very difficult to surpass the 6100–6150 range, if at all.
Invalidation Level - Because Elliott Wave (EW) is a probabilistic theory, there is always a chance the wave count is incorrect. We are maintaining 6172 as the invalidation level for this count (as previously stated).
Current Count
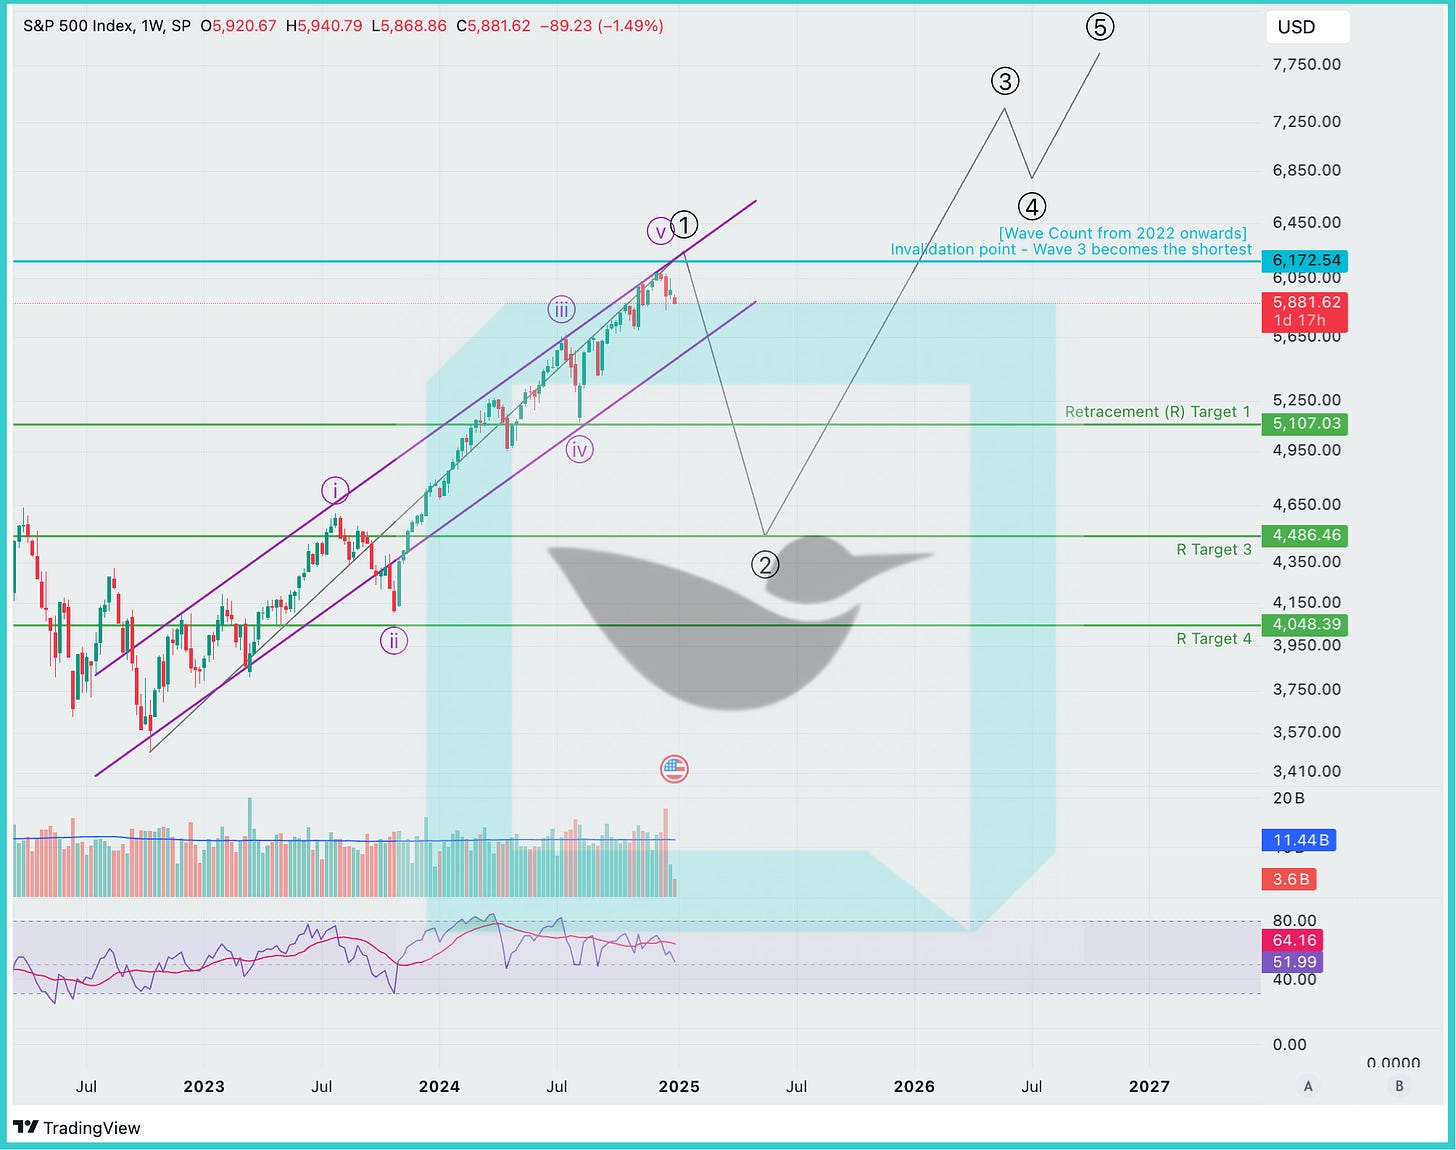
Wave 1 started in October 2022 and appears to have topped in December 2024.
Consequently, Wave 2 retracement should play out during most of 2025.
Wave A should drive prices lower, followed by a Wave B retracement to the upside, and then a larger Wave C decline. Our eventual target for Wave C lies between 4400 and 4000, implying up to a 30% correction from the SPX peak of around 6100. The first downside target is 5100, but a deeper correction is likely.
Weekly and daily charts below provide more details.
Chart Speak #1 - Weekly
Wave 1 that started in Oct 2022 has made a top and now the Wave 2 retracement has started
Wave 2 targets are marked on the chart below
Invalidation level - 6172 remains the invalidation level for this wave count.
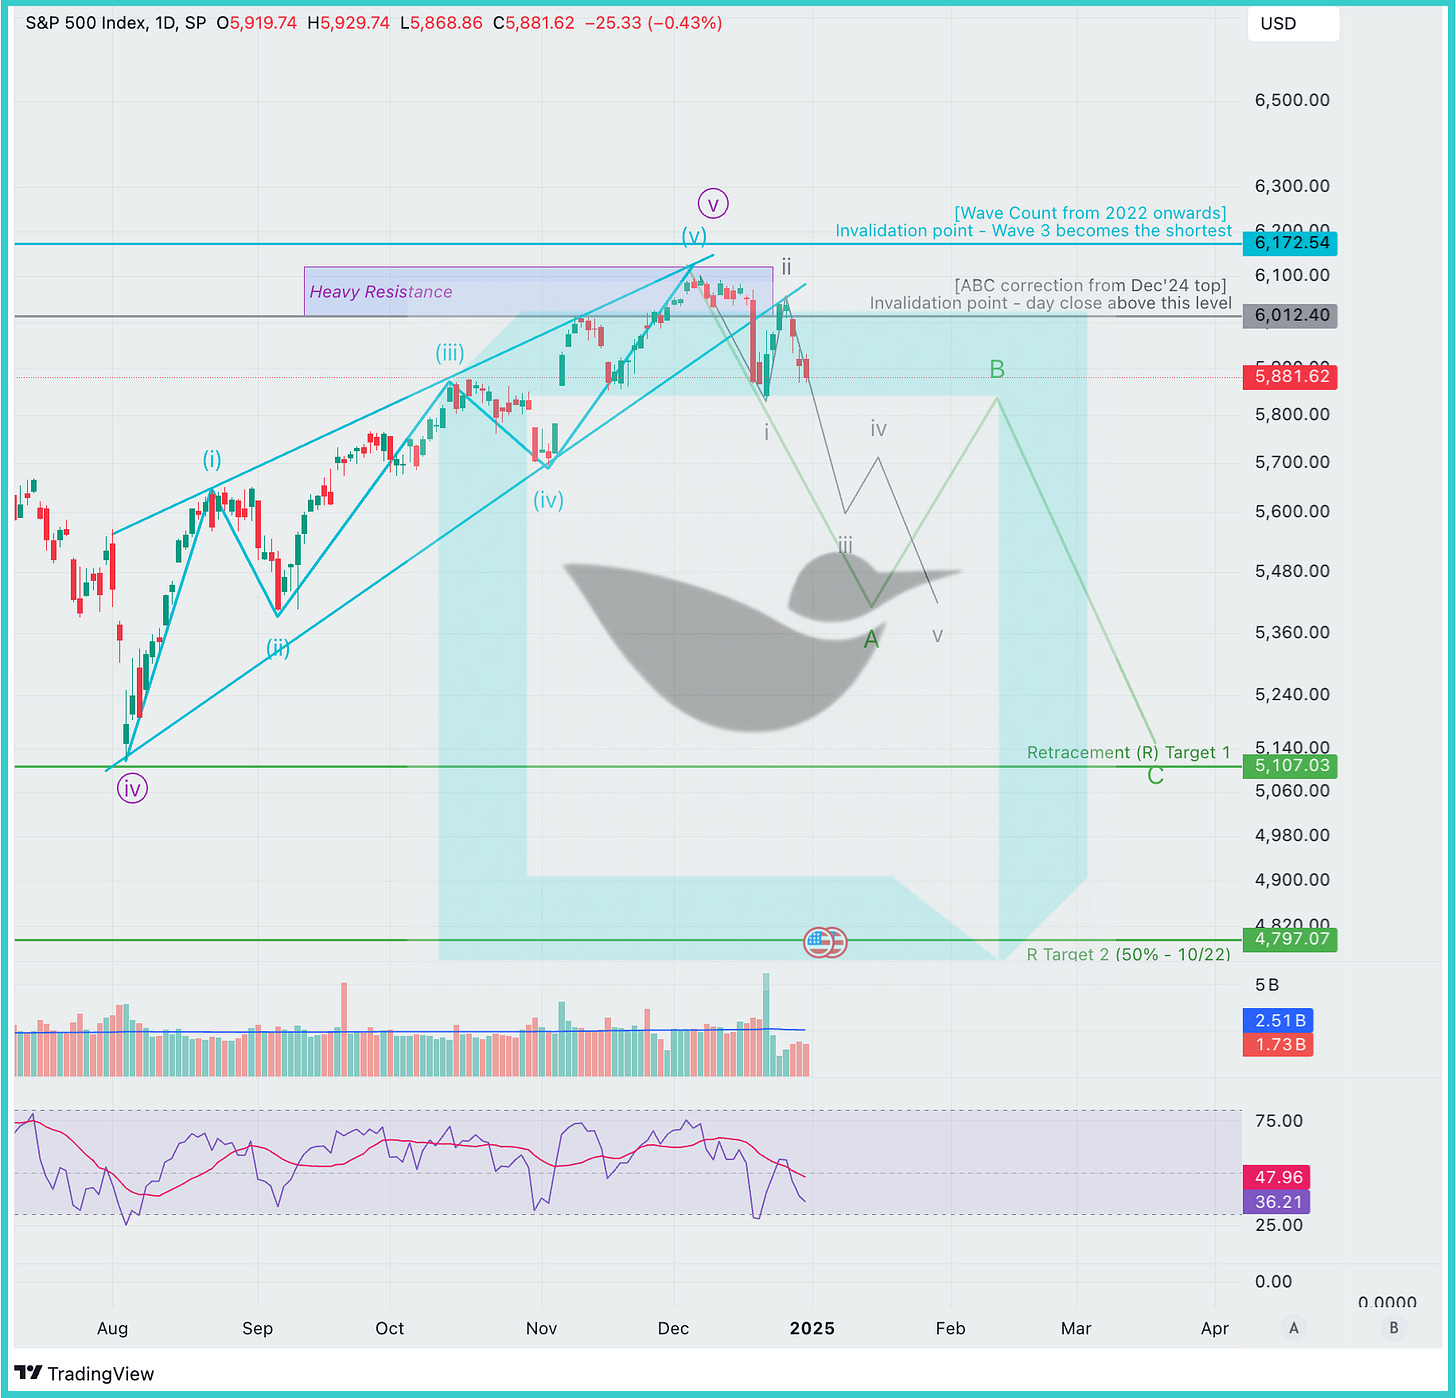
Chart Speak #2 - Daily
Wave 5 of the Wave 1 that started in Oct 2022 has made a top.
Wave 2 - ABC retracement has started.
Wave A should draw a five wave impulse pattern downwards. We believe Wave 3 of this impulse count is currently playing out.
Invalidation level - If the price goes above 6012 (in the current Wave A retracement) then we will need to revise this short term wave count.
Previous Update - 1st Dec’24
Elliott Wave Analysis | SPX CMP: 6032 | Dt - 1st Dec'24
Simple Speak
Our primary count thus far: A corrective wave for SPX should begin soon. Based on our estimates, SPX will find it very difficult to surpass the 6100–6150 range, if at all. We have maintained this count since October 2024.
Where do we stand now: Long-term charts continue to support the same story, and hence we are maintaining the same count for now. We are evaluating various short-term charts, which remain messy. This messiness could stem from two potential reasons (with their implications on our count):
High probability: Termination phases are rarely clear, unlike impulse phases. They are messy because distribution is taking place. New buyers are being drawn in, which wouldn't work effectively if the charts were clearly signaling a correction.
Low probability: Our wave count is incorrect, and the upward thrust will continue. We are monitoring this possibility, which is why we have an invalidation point for our primary wave count on the charts.
This post includes charts across different timeframes to illustrate the likely wave count.
Chart Speak #1 - Long Term
Wave count - Clear
If wave 5 exceeds 6172, wave 3 will become the shortest wave, invalidating this count. We believe SPX will find it very difficult to breach this level. Various momentum indicators are showing divergence on weekly timeframes.
Chart Speak #2 - Daily (Choppy)
Wave count - Unclear
Although we have labeled the five subwaves in this wave 5, the count is not very clear. This is not typical behavior for an impulse wave. The choppy movement is preventing us from identifying a clear wave structure. A significant bullish breakout (> 6172) from this point is highly unlikely; some form of correction should occur first.
Chart Speak #3 - 2H (Choppy)
Wave count - Unclear
Same as above. Wave count is not clear and a material bullish move (> 6172) from here looks unlikely.
Previous Update - 25th Nov’24
Simple Speak
Previous Update: A corrective wave should begin soon. Based on our estimates, SPX will find it very difficult to surpass the 6100-6150 range, if at all.
Where Do We Stand: The corrective wave began as predicted, with SPX dropping to 5850 before starting a retracement at a smaller degree (See: Chart #1). This retracement has extended much further than usual, with no clear signs of turning back down. The longer it takes for a vigorous third-wave drop to materialize, the less likely it becomes (See: Chart #2).
What if SPX Makes a New All-Time High?
Admittedly, this would slightly reduce the probability of our current primary count. However, considering the other available count options, we are still inclined to give our primary count some leeway.
If SPX breaks above 6000, it may indicate a flat correction, and we will adjust the target values for the next price drop accordingly.
That said, we continue to believe that SPX will struggle to cross the 6100-6150 range.
Chart Speak #1
Chart Speak #2
Previous Update
Elliott Wave Analysis | SPX CMP: 5984 | Dt - 13th Nov'24
Simple speak
Our prediction regarding SPX touching 6K if Republicans win was spot on.
Next prediction is now for a corrective wave to begin soon. Based on our estimates, SPX will find it very difficult to go past 6100-6150, if at all.


