


SMCI - Still have legs to make significant new highs, but first needs to negotiate the ongoing corrective wave pattern
Technical Analysis: Elliott Wave | SMCI CMP: 47.8 | Dt - 21st Oct'24

Tl;dr - SMCI, which had a massive run in its Wave 3 is now in its Wave 4. This count implies some more downside before a surge upwards in Wave 5. Given unclear wave count in Wave 4, there are three potential wave counts with varying degree of probability. This post captures charts and targets for each of those. Elliott Wave count by AlgoChirp and Analyst recommendations for SMCI are in sync at this point
SMCI - AlgoChirp Macro View
Simple speak - SMCI may see some more correction before making higher highs. Based on the wave count it seems it is currently in Wave 4 and it should be followed by a significant higher prices in Wave 5.
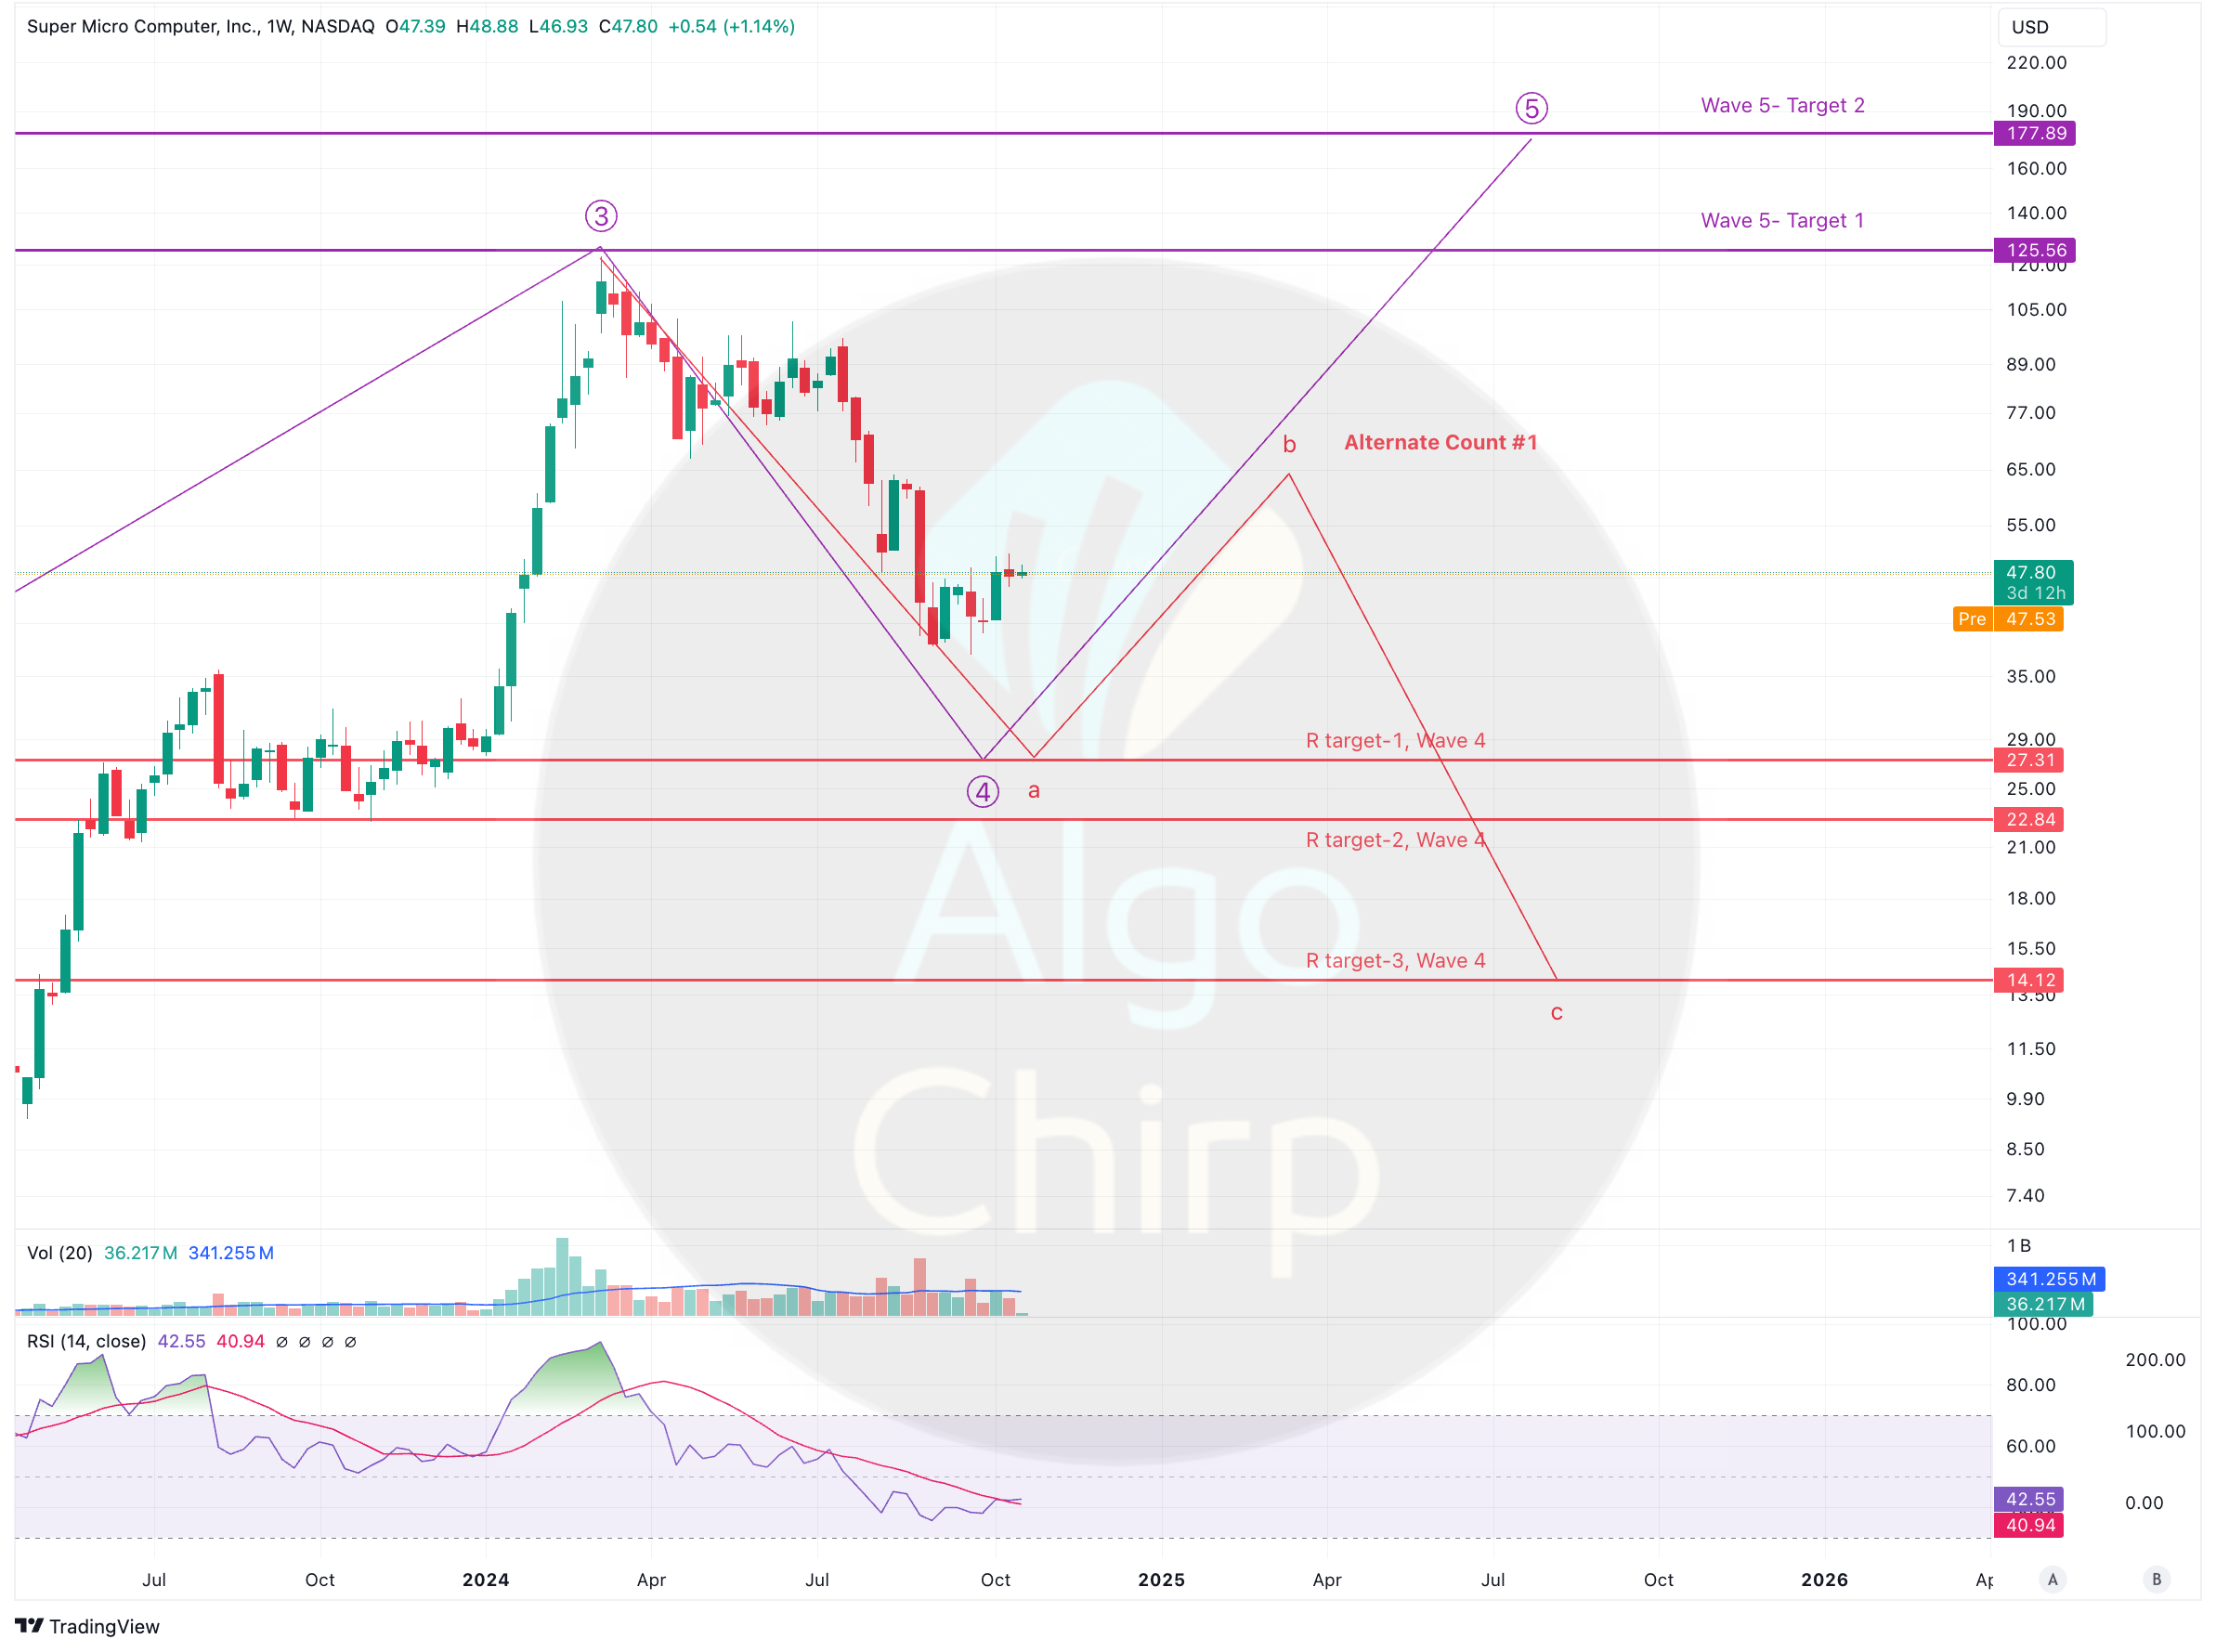
SMCI Chart #1

SMCI - AlgoChirp Short Term View
Simple speak - As is the case in corrective waves, the internal wave count in Wave 4 of SMCI is not super clear. This gives way to a few possibilities and those are listed in decreasing order of probability.
Wave C still has some way to go and it should turn bullish post that
The current wave is merely Wave A and Wave B & C are still pending. This implies more downside in the short term.
Wave ABC has played out and the price should turn bullish from this point onwards
Price targets for each of these options are given in the charts below.
SMCI Chart #2

SMCI Chart #3
SMCI Chart #4

TA speak - Elliott Wave analysis by AlgoChirp
Wave 4 of the Impulse Wave that started in 2009 is currently underway. Wave 3 of this same impulse wave pattern made SMCI a darling of stock market.
Wave 4 internal count is not super clear and that gives us three potential wave counts. Based on Fib retracement guidelines for different Elliott waves, these three potential options are listed below in the descending order of probability
Chart #2 - Wave C has some more way to go
Chart #3 - Current corrective wave is Wave A, this should be followed by Wave B & C
Chart #4 - Wave ABC is now complete and a new impluse wave has started or will start soon.
The complex and uncertain nature of price movement is typical of a Wave 4 retracement. Wave 4 can often take a complex form and consume more time and that is why Chart #4 highlights a trend line. A price breakout above this trend line will make this count the preferred count.
Analyst Rating vs EW count
Analyst rating suggests bullish outlook for SMCI. EW projection is also similar although after a brief period of price correction.
Long term - Analyst rating is “In sync” with EW count
Ultra short term - Analyst rating is “not in sync” with EW count

Source - Yahoo Finance
