


QQQ (Nasdaq) - The current wave count is playing as expected. US Election week holds the key, EW projects a correction.
Elliott Wave Analysis | QQQ CMP: 495.4 | Dt - 29th Oct'24

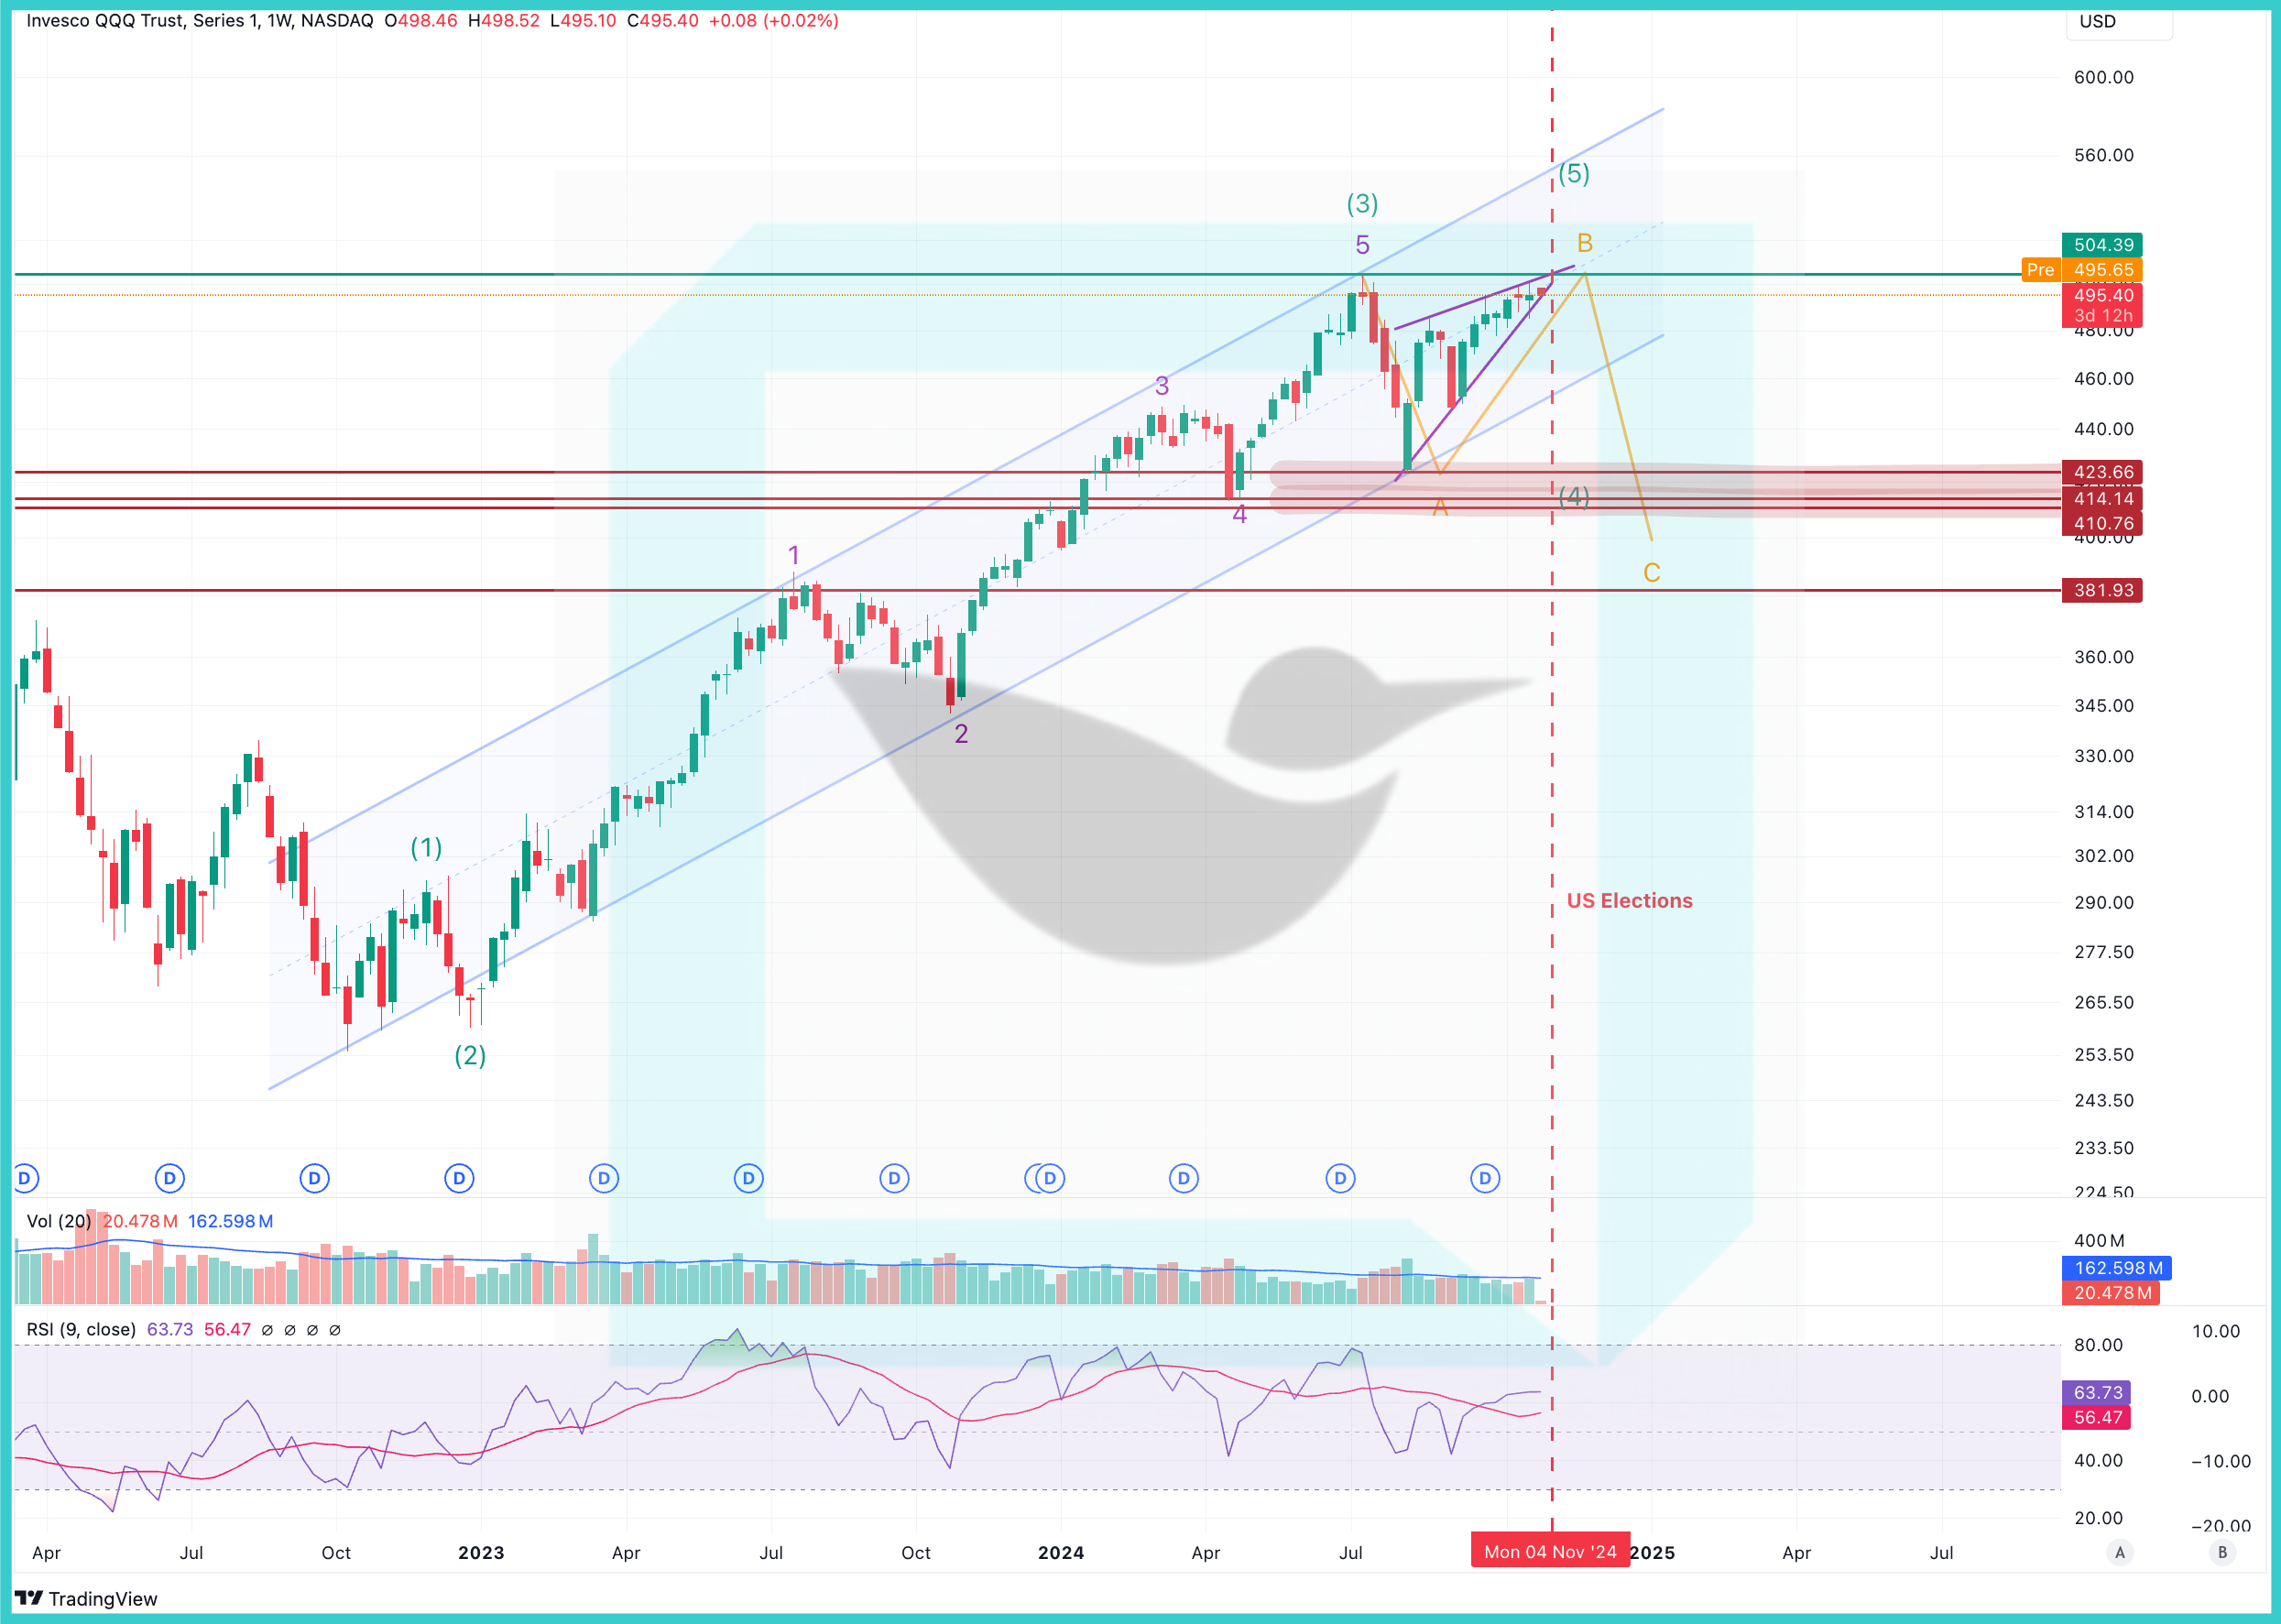
Tl;dr - Our EW count for QQQ is still on track. Per which, QQQ, which has had an extended Wave 3 advance is currently in its Wave 4 corrective pattern. This pattern should see it test further lows in the ongoing A-B-C correction. It seems the week of Nov 4th is going to be critical for lot of stocks and the Index as well.

Simple speak
QQQ, which has had an extended run up since Nov’22 is now reaching a key level in the corrective pattern and the timelines seem to perfectly overlap with US elections.
This corrective pattern is EW Wave 4. Within this wave, Wave B is playing out in an Ending Triangle pattern and it appears to be in its last leg. With this a Wave C decline should commence, dragging the index lower.
Based on Elliott Wave count the odds are in favour of a correction over the next few weeks. Prices can drop to $420-$380 (~20-30% drop from the current levels)
Price may breakout above the pattern during the week of Elections, but it may end up being a “Bull Trap”. We should be careful!
Alternate count - Although it has a very low probability at this stage, the alternate count suggests the ABC correction has already ended and Wave 5 advance is underway.
Alternate count #1 - Wave 5 target is higher (2 or 3) and QQQ has some runway before it heads lower
Alternate count #2 - Wave 5 target 1 is met at $504 and then QQQ heads much lower
Chart speak #1 - Zoom in
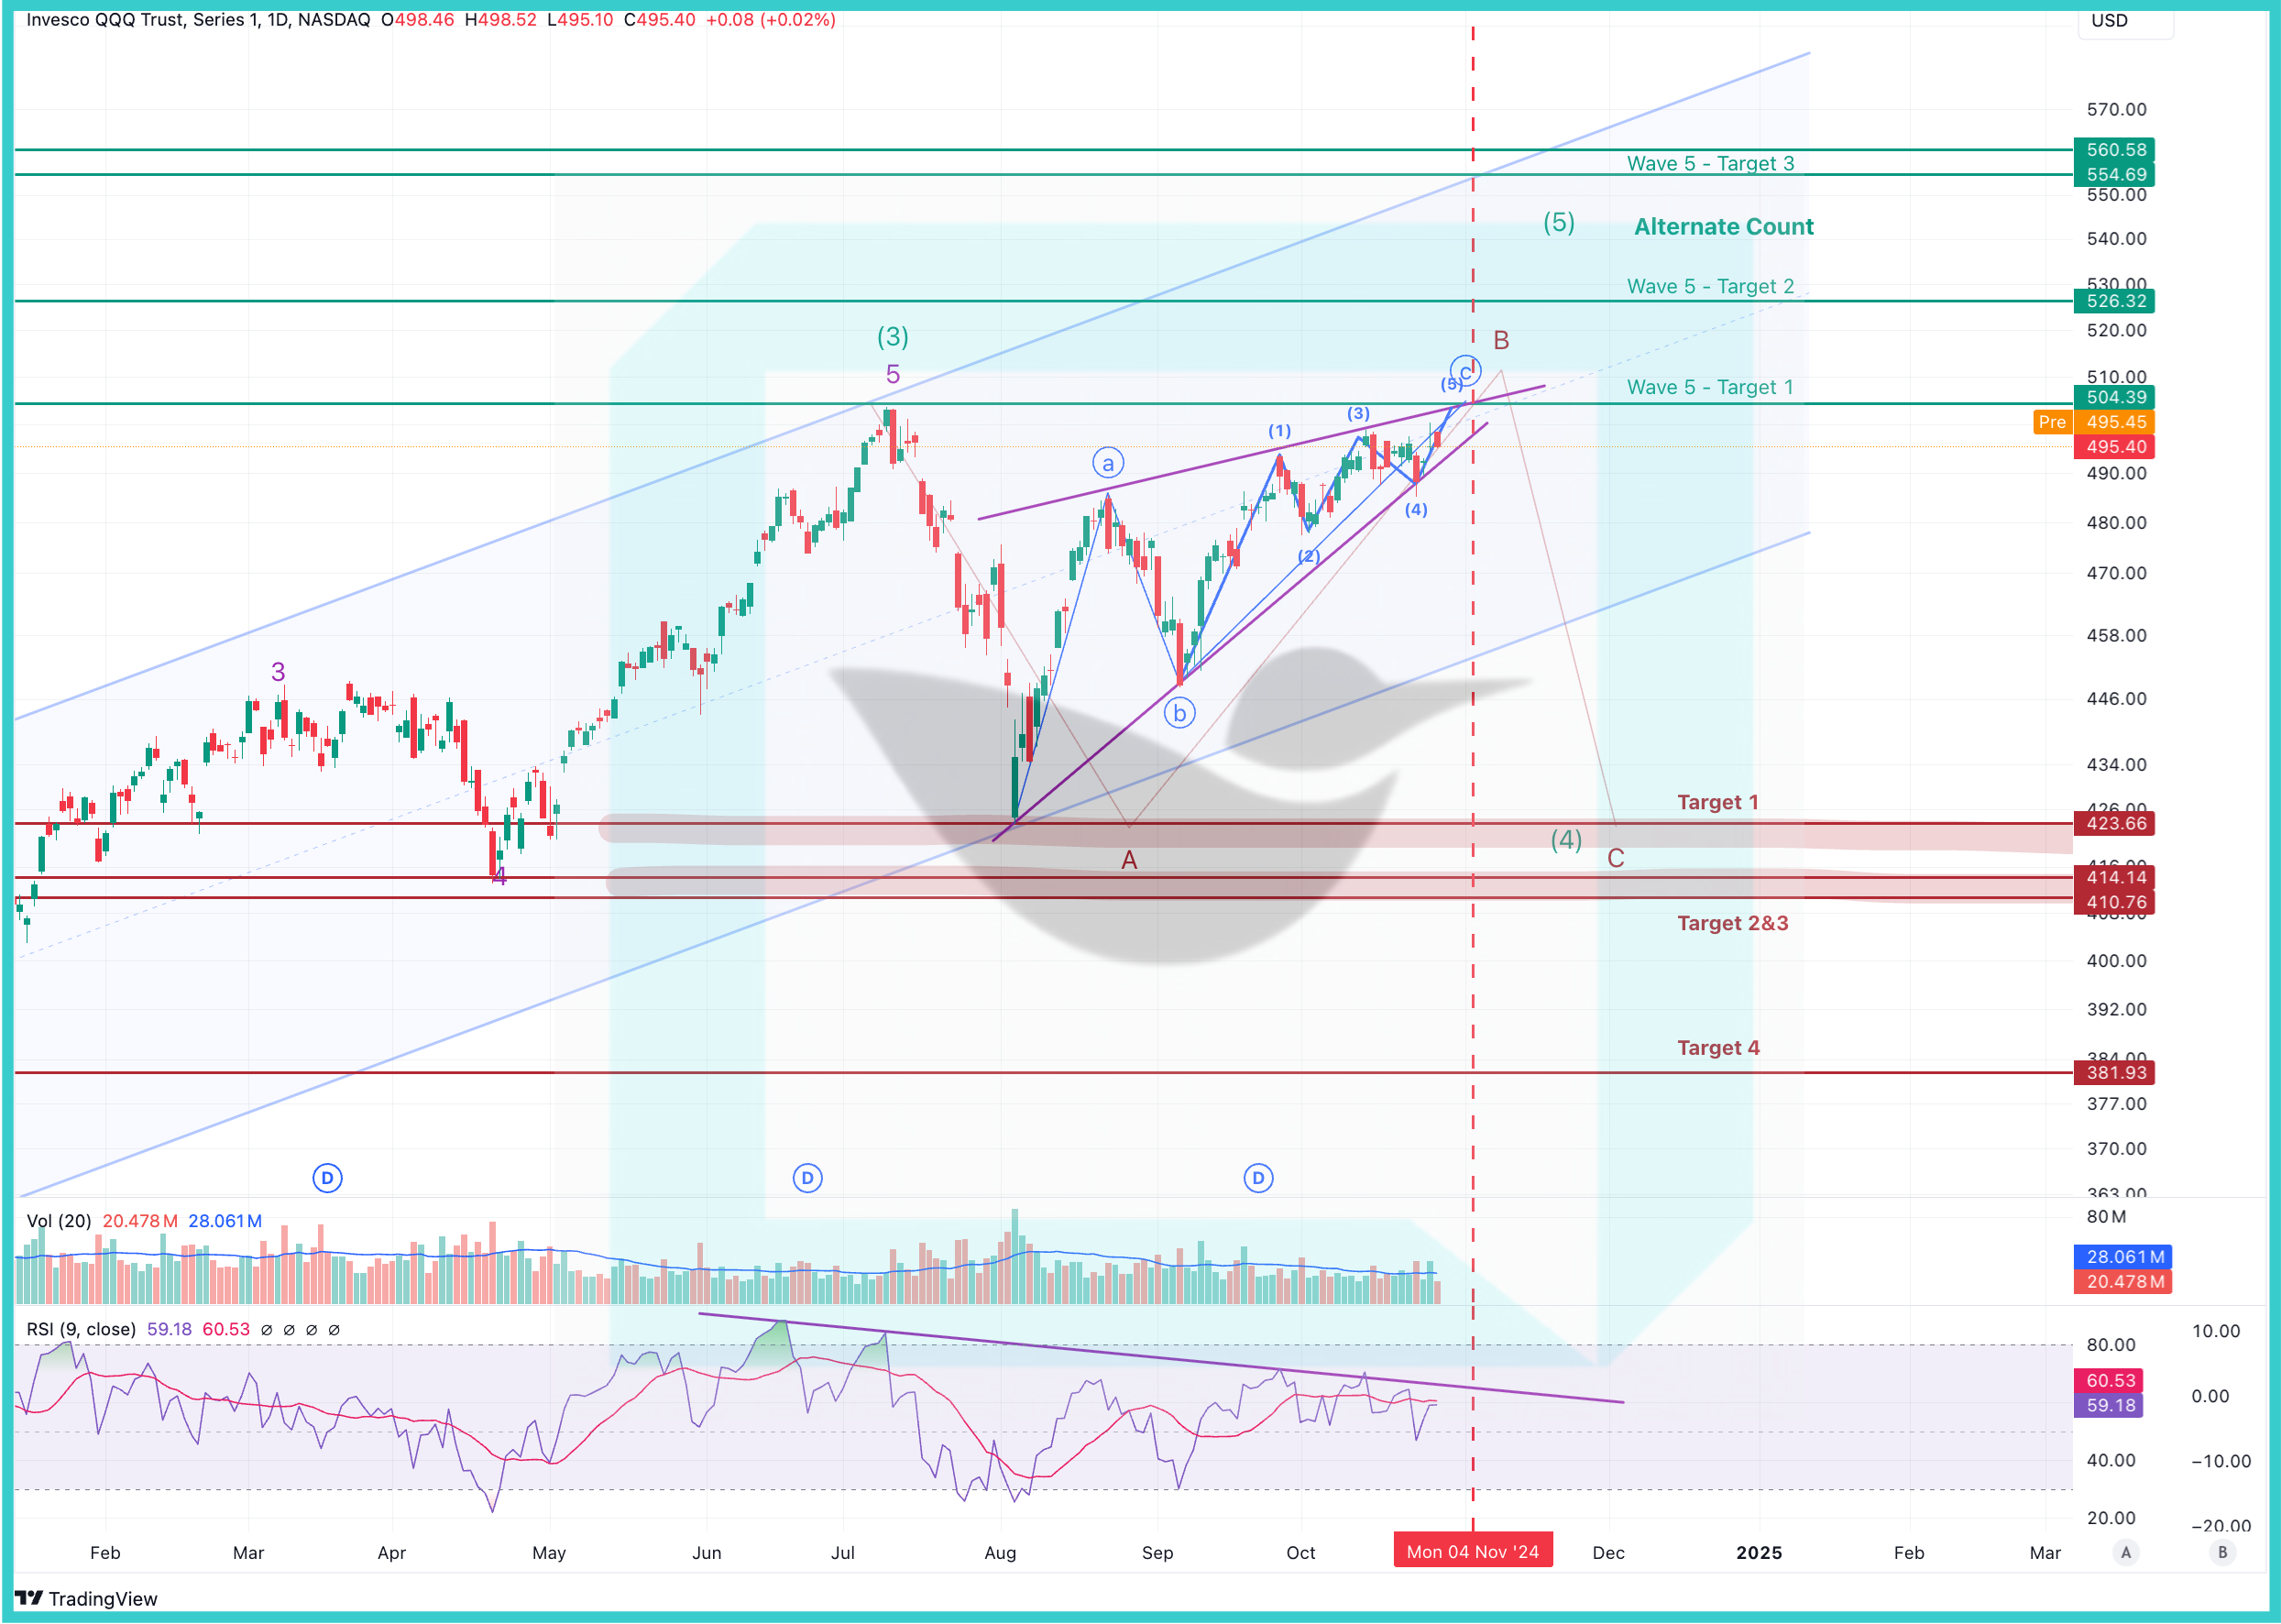
Chart speak #2 - Zoom out
Detailed analysis from the previous week below
Previous update - 15th Oct’24
Tl;dr - QQQ, which has had an extended Wave 3 advance is currently in its Wave 4 corrective pattern. This pattern should see it test further lows in the ongoing A-B-C correction. Once the ongoing retracement ends, it should start its last Wave 5 advance to new highs.
Key Highlights - EW Analysis by AlgoChirp
QQQ is currently in corrective Wave 4. Within this wave Wave B is playing out in an Ending Triangle pattern and it appears to be in its last leg. With this a Wave C decline should commence, dragging the index lower.
If RSI breaks above the sloping trend line & if price makes a new high then it would be a good indication that Wave 5 has started.
Alternate count (Daily Chart) - Although it has a very low probability at this stage, the alternate count suggests ABC correction has already ended and Wave 5 advance is underway.
Chart #1 - Weekly

Chart #2 - Daily

Analyst Rating vs EW count
Analyst rating suggests bullish outlook for QQQs. Per EW, short term projection is for price to make lower lows
Analyst rating is “not In sync” with EW count
