Google - As expected, price should drop to $140 range first before starting a massive rally upwards
Technical Analysis: Elliott Wave | GOOG CMP: 172 | Dt 18th Nov'24
Simple Speak
Long term - Google has a very bullish setup over a longer period of time. That is once the ongoing corrective pattern ends.
Short term - In the immediate term, Wave C has just started and it is likely to take the prices significantly lower vs today.
Wave count - Google started a new 12345 impulse wave in Nov’22, Wave 1 of this impulse pattern ended in July’24. Since then it has been in an ABC corrective pattern.
Given Wave A had 3 waves, the odds for a flat correction are higher. Which means prices should not fall beyond $130-$140 range. If it is a flat then the price might also have a final surge up ahead and may touch $185-$190 before heading downwards. Recent price action however suggests the odds for this are low.
Chart Speak #1
Chart Speak #2
Previous Update - 24th Oct
Technical Analysis: Elliott Wave | GOOG CMP: 162 | Dt 10/24
Tl;dr - GOOG, will continue its march higher over the next few years and the current AI wave won’t make the company redundant. However, in the short term there is some turbulence ahead.
Section 1 - Simple speak
Google has had a good run since making a low in Nov’22 and it has made new all time highs in July’24. Based on Elliott Wave technical analysis, the July top marked an end of an impulse wave and hence price started correcting.
This ongoing correction has more room to go and can potentially take the price down to $130-$110 levels over the next few months.
Once this corrective wave is over, Google should resume its upward trend to make new all time highs.
GOOG Chart #1 - Macro view
Section 2 - Technical Analysis using Elliott Waves
Summary
GOOG has been in a massive impulse wave since its IPO. It appears it has completed Primary Wave 3 & Wave 4, and it started the final Wave 5 on Nov’22. Wave 1 of this Primary Wave 5 has traced out five impulse waves of its own.
This Primary Wave 5 should see the price reach new highs, going as high as $500 during the next few years (Chart #2).
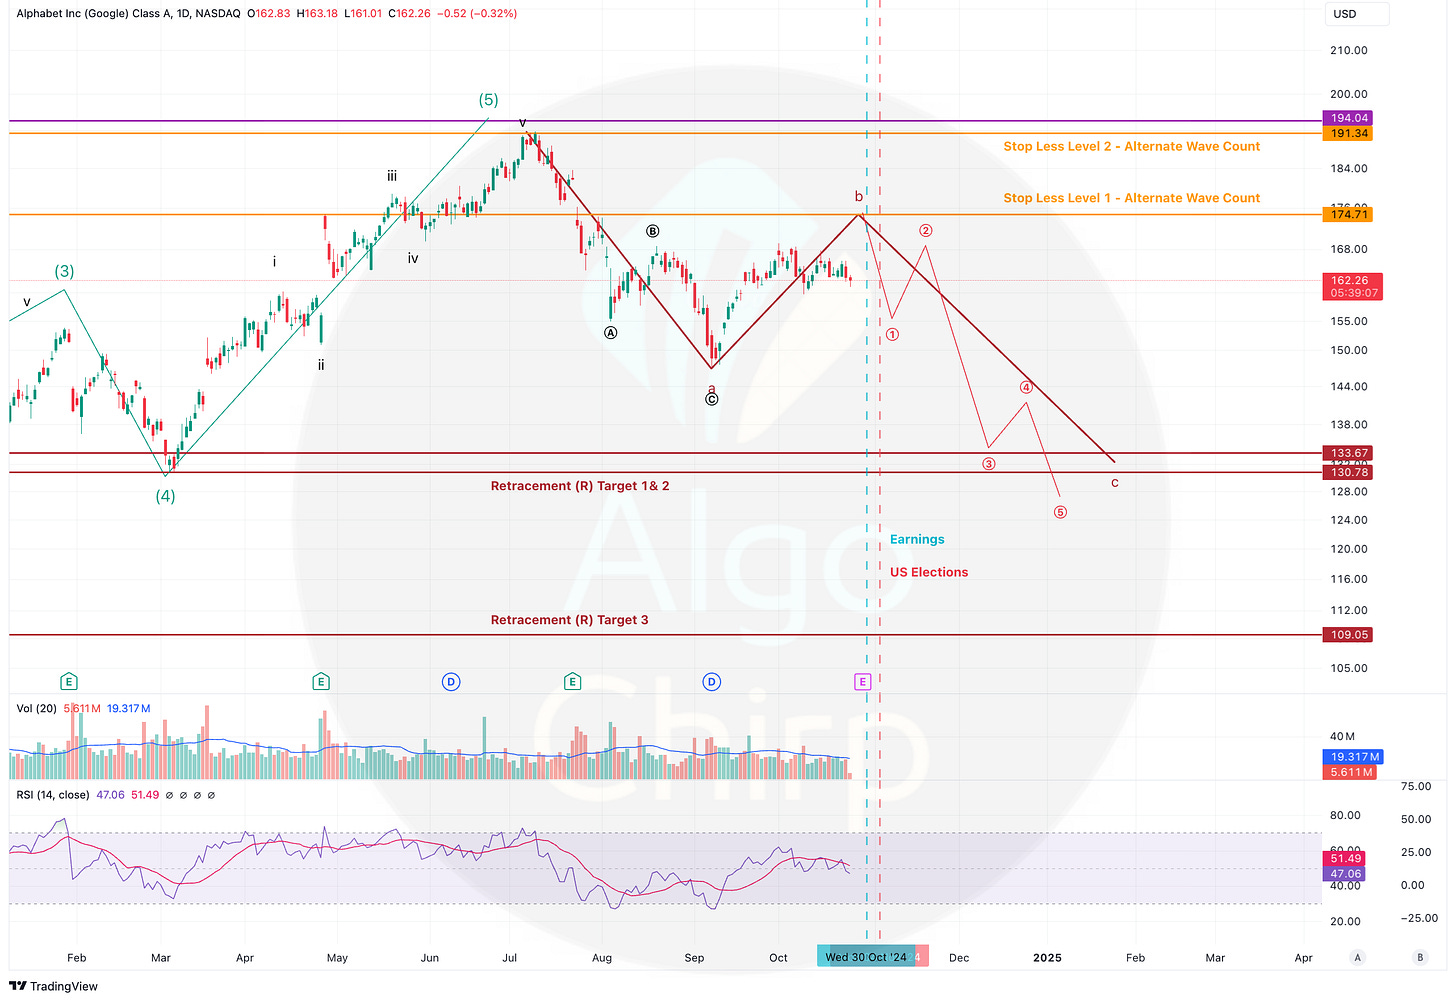
However, the first resistance that it is encountering is in the $190 area and that happens to be the end of Wave 1 of a lesser degree. Five wave impulse that started in Nov 22 ended in July 24, near $190 resistance area and since then GOOG started an A-B-C retracement. This corrective way is still ongoing.
It appears this retracement still has some way to go and it may see the price drop to $130, or even to $110 if the overall market turns out to be weak.
Vertical lines in Chart 3 can be seen as inflection points. They represent GOOG Earnings & US Elections.
Alternate count - If the price breaks the Orange stop loss levels then we will need to reconsider the current wave count.
GOOG Chart #2 - Zoom out
GOOG Chart #3 - Technical levels
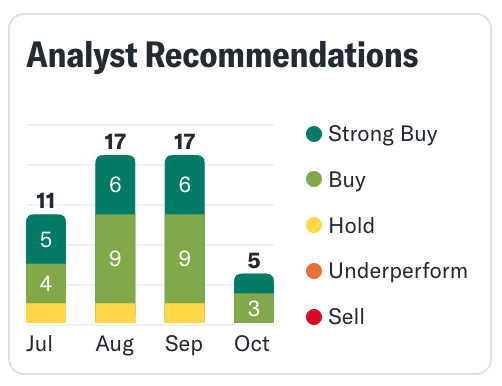
Section 3 - Analyst Rating vs EW count
Analyst rating suggests bullish outlook for Alphabet/GOOG. EW projection however is for the price to start a corrective leg in the short term before resuming the upward trend.
Short Term - Analyst rating is “not in sync” with EW count
Long Term - Analyst rating is “In sync” with EW count


