


BTC - Hanging in balance. If it fails to break above then will likely drop to $15K
Technical Analysis: Elliott Wave | BTC CMP: 67040 | Dt - 22nd Oct'24

Tl;dr - BTC, which has been in an impulse wave since its inception around 2012. It has either completed the five wave impulse pattern or is in final stages. Given the sluggish nature of price movement off-late, the wave count is not ultra clear and hence both the scenarios are possible. If the price breaks above $73K, then it will bolster the odds of the last Wave 5 high. If it fails to break above then the odds for a massive A-B-C correction would increase. Both the scenarios are explained below.
Simple speak
If BTC fails to break above $73K then it should head lower over the next few months. Likely to hit $15K (high probability) or even $3K (low probability).
However, if it breaks above $73K then it can reach $90K-$100K, before starting a massive A-B-C correction, taking the price significantly lower.
Wave Count - Interpretation 1
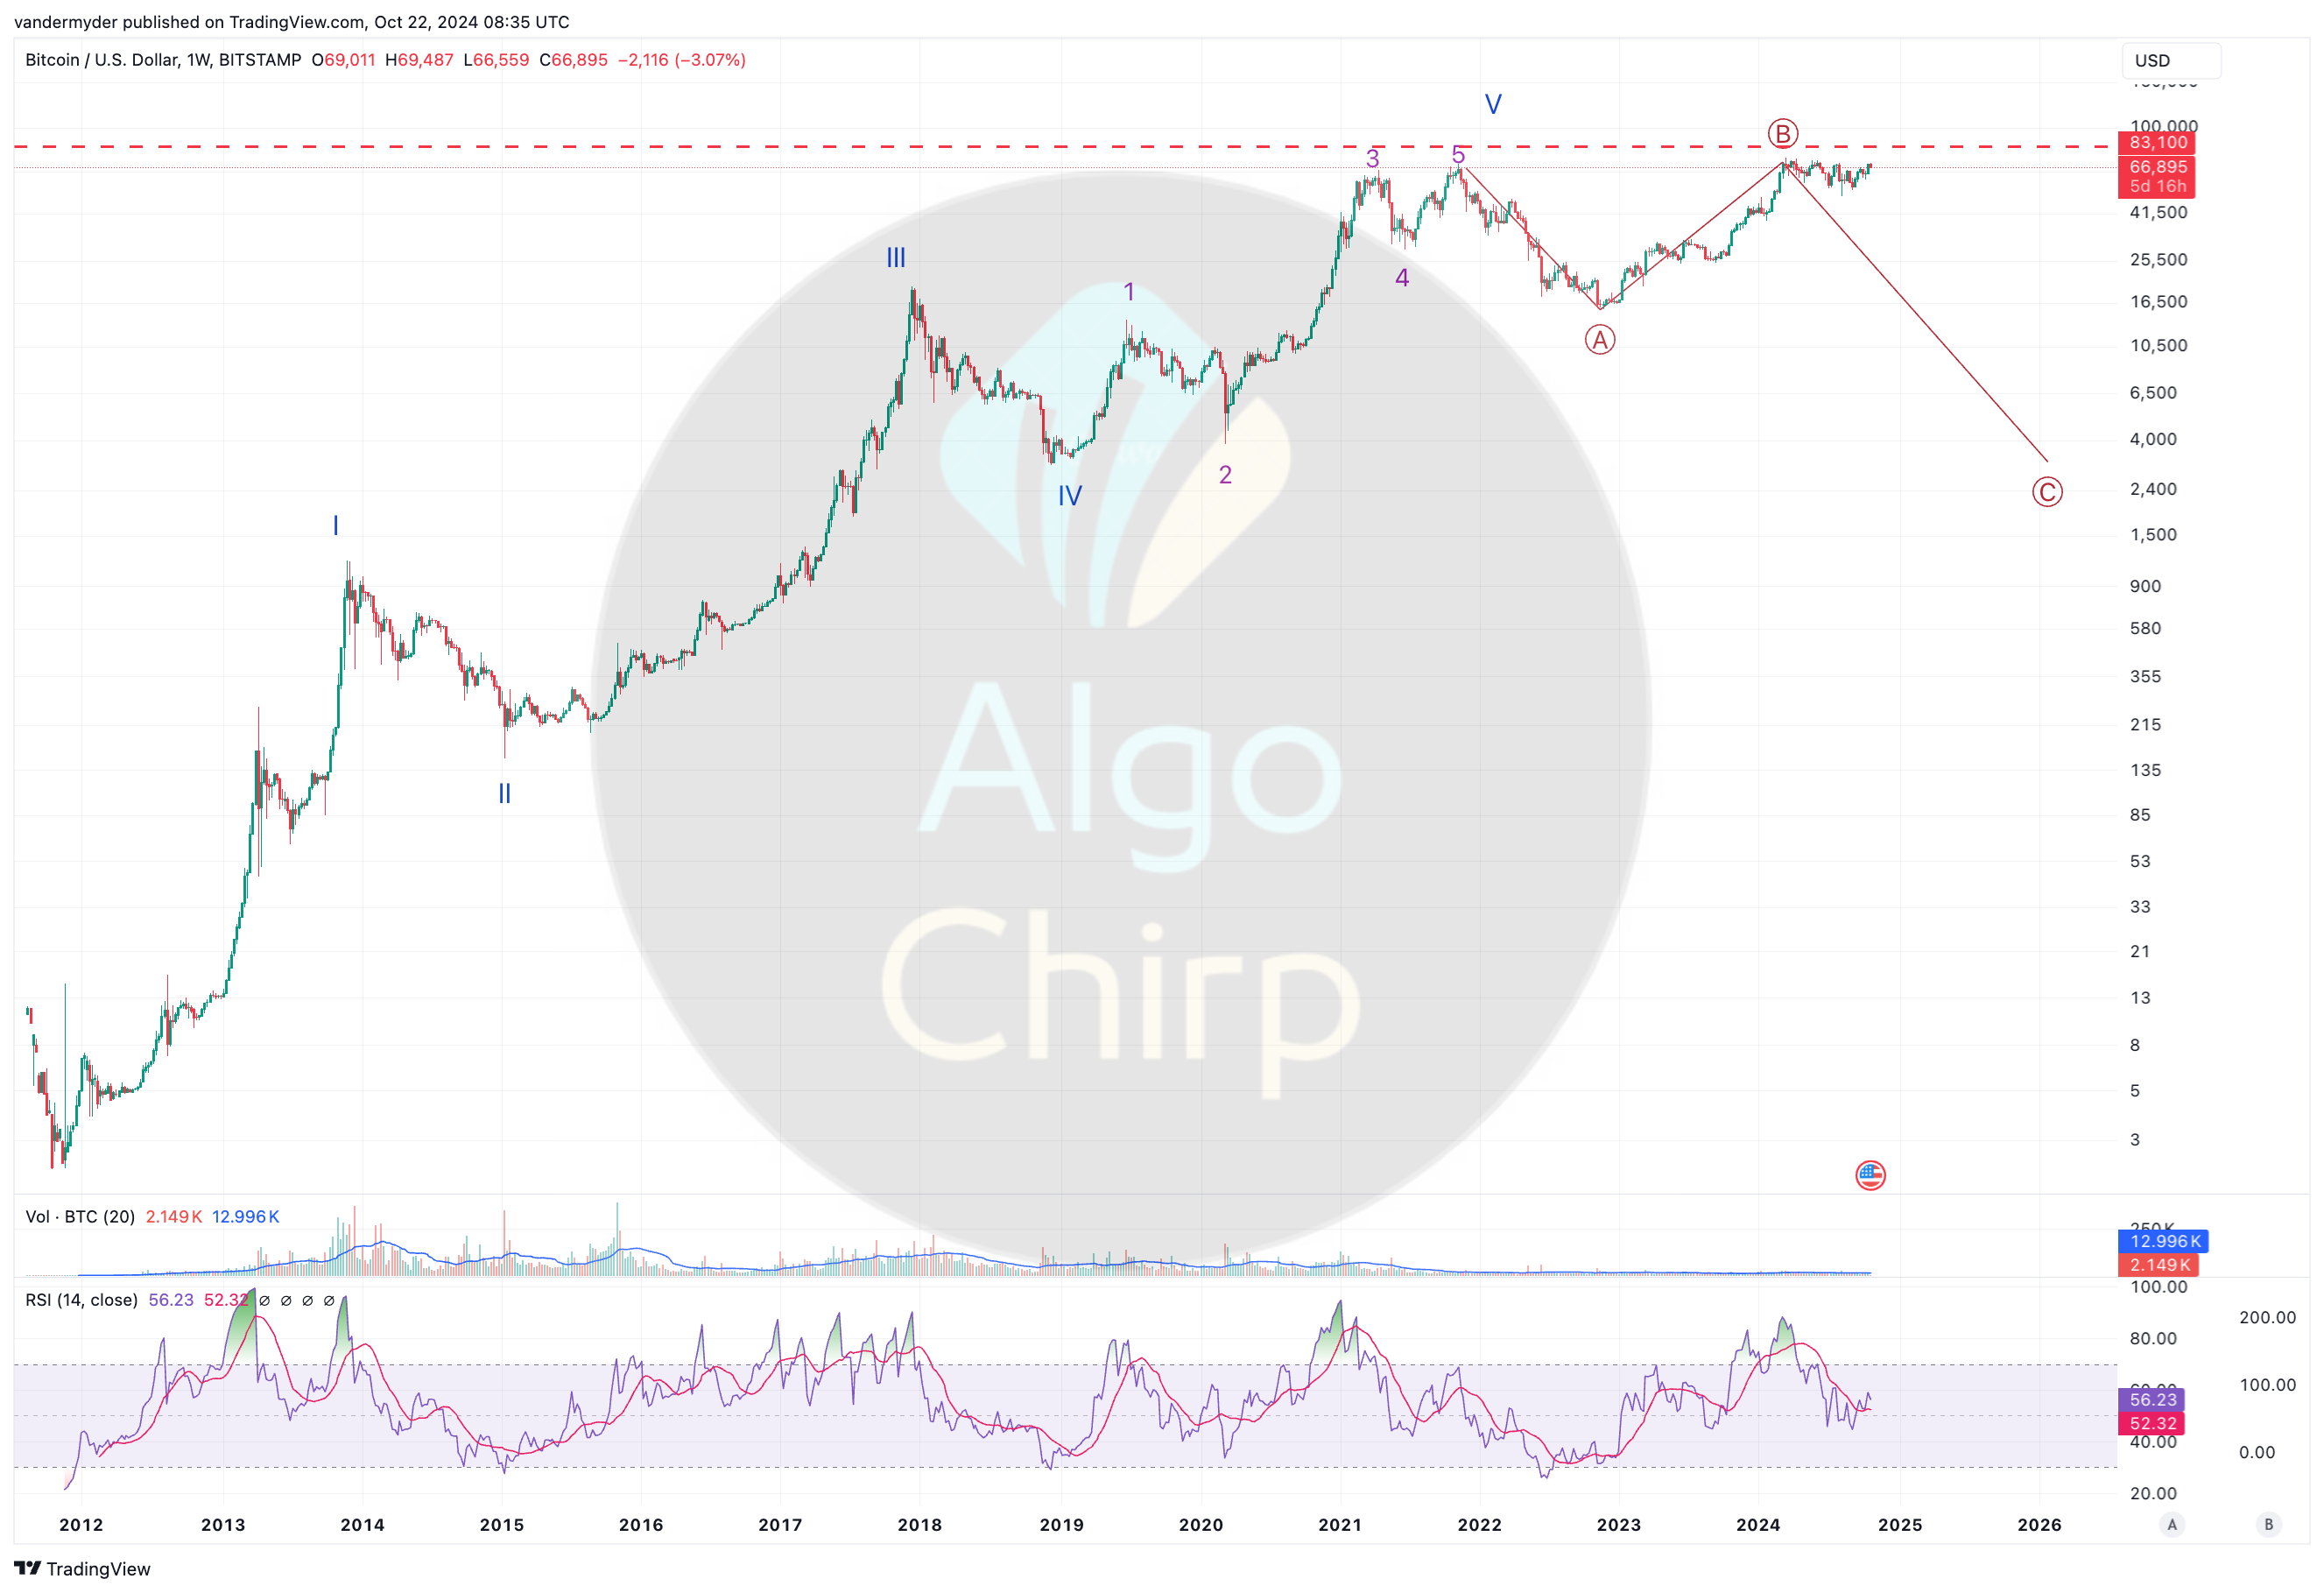
BTC Chart #1 - Zoom Out

BTC Chart #2 - Zoom In

TA speak - Elliott Wave analysis by AlgoChirp
BTC Wave 1-Wave 5 impulse wave that started in 2012 is in its final leg. After the ongoing Wave 4 of a smaller degree the Wave 5 advance should start. This advance will be the end of Wave 5 impulse on three different degrees and should be followed by a significant decline in A-B-C pattern.
Final Wave 5 advance should see the prices reach $90K-$100K levels, if not higher. We expect this advance to be weak and end with significant RSI divergence.
Alternate count - If BTC fails to break above the expanding diagonal pattern highlighted in the Blue chart then we will be forced to consider an alternate wave count, called out as Interpretation 2 below
Wave Count - Interpretation 2
BTC Chart #3 - Zoom Out
BTC Chart #4 - Zoom In

TA speak - Elliott Wave analysis by AlgoChirp
BTC Wave 1-Wave 5 impulse wave that started in 2012 is already over and BTC has now started the corrective wave pattern (A-B-C). As part of this corrective wave pattern, currently Wave B is playing out.
This wave should be followed by a sharp correction in Wave C. As part of this correction, BTC should drop to either $15K or $3K.
Alternate count - If BTC breaks above the triangle pattern then Interpretation #1 explained above will be the leading Wave count.
Interpretation #1 vs #2
BTC is currently making an expanding triangle and beginning of Wave C is an odd place for this pattern to play out and that is why Interpretation #1 is the leading wave count for us. A break above or below this pattern will determine which count remains valid long term.