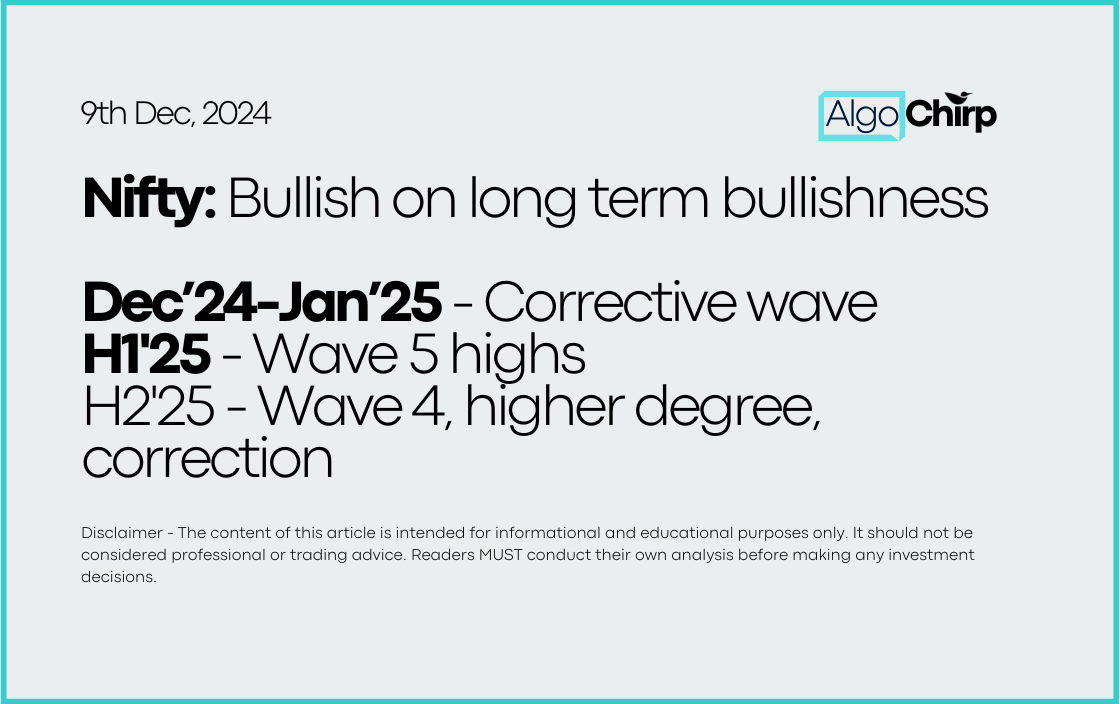
[2025 Outlook] Nifty - Bullish in H1'25 and bearish in H2'25
Elliott Wave Analysis | CMP: Nifty 24100 | Dt: 3rd Jan, 2025
2025 Outlook
Overall outlook
Nifty is currently in a long-term impulse pattern and still has significant room to grow. This long-term impulse structure could potentially extend beyond 2030.
2025
The five-wave impulse pattern that started in 2022 is currently in Wave 4, which should end soon.
First Half of 2025:
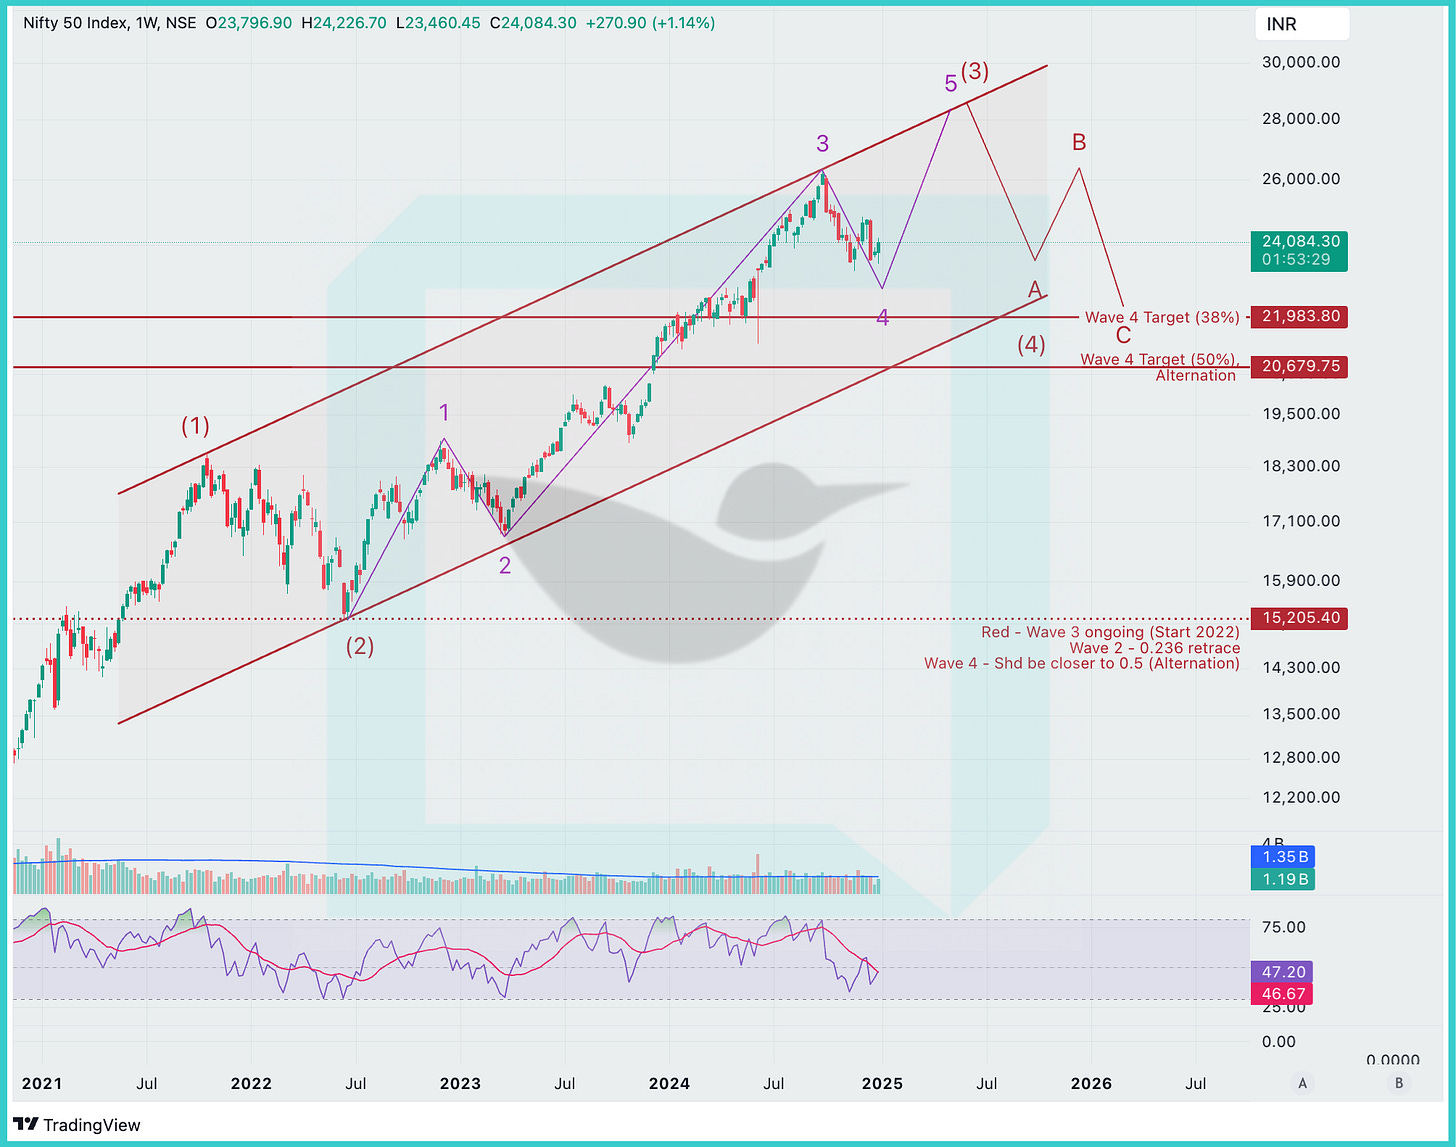
Prices are expected to make new highs in Wave 5. Our wave count suggests Nifty could cross 28,000 during this wave, representing a rise of more than 16% in the first half of the year.
Second Half of 2025:
As part of an ABC decline in Wave 4 of larger degree (EW Wave 1 that started in 2020), Nifty should correct to the 22,000–20,500 range. From its top, this may represent a decline of more than 25%.
A detailed wave count with charts at different timeframes can be found here.
Chart Speak #1 - Long Term
The current impulse wave (red) started in 2020 and the Wave 3 is currently playing out. Wave 3 may end around mid of 2025.
Second half of 2025 will likely be part of a Wave 4 (red) - ABC decline.
More details and charts are mentioned here.
Chart Speak #2 - Short Term
Current ongoing ABC pattern in Wave 4 (EW started in Oct 2022) is in its final stages, with most probably termination target between 23440 - 23000.
EW guidelines suggest Wave A = Wave C and that implies a Wave C termination target of 22000. However, given the channel 23000 seems more likely.
Previous Update
Elliott Wave Analysis | CMP: Nifty 24677 | Dt: 9th Dec, 2024
Simple Speak
Nifty, currently in a long-term impulse pattern, still has significant room to grow. One should continue to invest for the long term, including through mutual funds. This impulse structure could potentially extend beyond 2030.
Wave 3, which started in the early 2000s, still seems to have some way to go. Subsequently, Wave 4 is likely to bring about a meaningful decline, tentatively beginning in 2026.
For a first part of the next year, 2025, Nifty is expected to be in Wave 5, during which it should rise significantly.
In the very short term, however, a corrective Wave 4 is currently unfolding and may require 4–8 weeks to resolve. Corrective waves can often develop into more complex patterns, so it will be necessary to wait and see how this one evolves.
Below are four charts, each zooming in to a shorter time frame and showing the wave count at a smaller degree.
Chart Speak #1 - Long Term
Long term impulse pattern, currently in Wave 3 (Green). Within this Wave 3, currently the final Wave 5 (Blue) is underway.
Once this Wave 5 (Blue) is done it will bring about the end of Wave 3 (Green), Wave 4 (Green) will bring about a meaningful correction.
Chart Speak #2 - Mid Term
Zooming in, the current impulse wave (red) started in 2020 and the Wave 3 is currently playing out. Wave 3 may end around mid of 2025.
Second half of 2025 will likely be part of a Wave 4 (red) decline.
Chart Speak #1 - Short Term
Zooming in further, the current impulse wave (Purple) began in 2022, and Wave 4 is currently unfolding. Once this wave concludes, a Wave 5 advance should begin.
We expect Wave 5 (Purple) to take shape between February and May 2025. When Wave 5 (Purple) ends, that will also mark the completion of Wave 3 (Red).
The second half of 2025 may not be favorable for the Nifty, as Wave 4 (Red) will start developing during that period.
Chart Speak #1 - Primary Count
Zooming in further, the odds favor an ongoing corrective Wave 4 (Purple), which appears to be developing into a ZigZag ABC (Grey).
It currently seems to be in a Wave B counter-trend rally, which may end within a few days to a few weeks.
Once Wave B concludes, it should initiate a Wave C, driving prices lower.
From mid-December to the end of January, the Nifty is expected to drop to new lows.
Alternate Count: There is also a possibility that Wave 4 has already ended and Wave 5 is underway, though this scenario currently has a lower probability.


