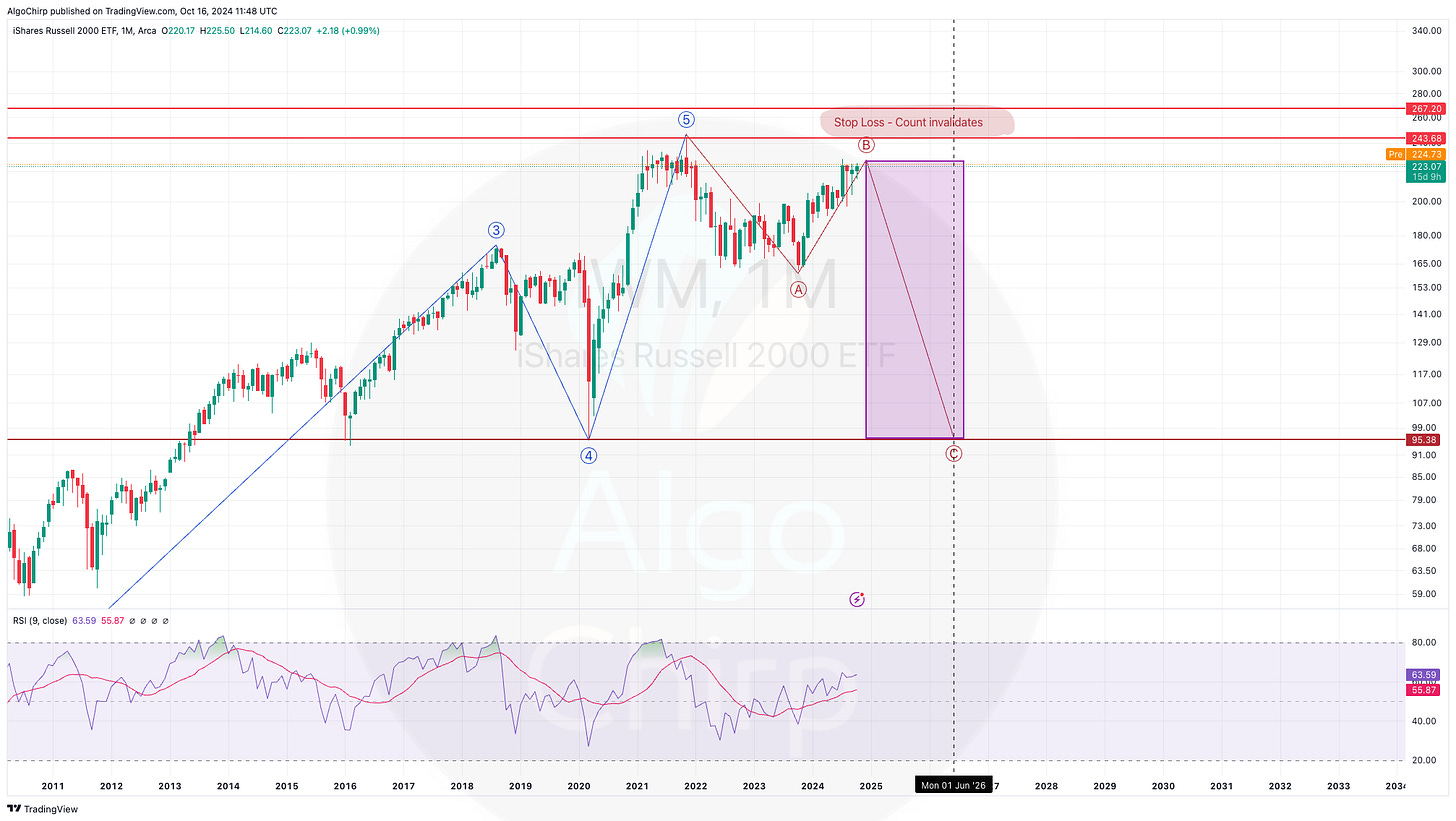
[2025 outlook] IWM - Wave C retracement will likely span most of 2025, and IWM could decline by 30% or more from its November 2024 top.
Technical Analysis: Elliott Wave | IWM CMP: 223 | Dt - 2nd Jan'24
2025 Outlook
Simple Speak
The AlgoChirp IWM Wave Count has played out as predicted. For all the relevant Wave Count charts, please refer to our previous post.
Since our last update, the IWM chart has become clearer, and our primary count has gained more confidence. The ongoing Wave retracement that started in Q1 2022 is now beginning its final Wave C decline.
2025 outlook - The predicted Wave C is likely to unfold over 2025 and early 2026. During this period, the price should retrace to the 164 region, where Wave A = Wave B = Wave C, completing a flat retracement. This would mark 33% decline from Nov’24 top for IWM. If market weakness continues, Wave C could exceed both Wave A and Wave B.
Invalidation level - We will maintain this wave count as our primary count unless IWM rises above 267. We believe the 244–267 region will present strong resistance, and therefore our 2025 outlook remains bearish.
Potential alternate wave counts are captured in our previous post.
Chart Speak - Primary Count
Previous Update
Simple Speak
IWM formed a multi-year top in 2021 and has been in a corrective pattern since then. It is not entirely clear whether this corrective pattern has ended or is still playing out.
2025 is likely to be a challenging year for IWM. If the corrective pattern is still ongoing, 2025 could bring a significant drop in IWM. If the corrective pattern has ended, the immediate short-term price should move higher but is expected to begin a corrective wave in Q1 2025. (Chart #1 & #2)
Primary Count: The ABC corrective pattern is still playing out. The current price rise is a Wave B retracement, which can advance to a maximum of 267. If our primary count is correct, the price should retrace significantly in a Wave C drop, represented by the Green box in Chart #1.
If the price moves above 267, we will need to adopt our alternate count as the primary count.
Alternate Count: The ABC pattern ended in October 2023. A new impulse pattern began then and is currently underway.
However, given the choppy price action in the current move (see Chart #3), it does not resemble an impulse wave, which is why this count remains our alternate count.
Even if this count is correct, a Wave 2 retracement is likely to start soon, suggesting that IWM could move lower for most of 2025.
AlgoChirp’s EW Analysis: For 2025, IWM shows massive downside potential (25–50% drop) with relatively limited upside potential (~10% rise) at current levels.
Chart Speak #1 - Long Term
Primary wave count - Option 2 below
Alternate wave count - Option 1 below
Chart Speak #2 - Primary Count
Chart Speak #3 - Alternate Count
Previous Update - 15h Oct’24
Technical Analysis: Elliott Wave | IWM CMP: 223 | Dt - 15th Oct'24
Tl;dr - IWM has one of the cleanest charts adhering to various EW guidelines. And it is suggesting that a massive Wave C decline lies ahead. This outlook is not for short term, but given how far Wave B has retraced, the start of the decline is not years but merely weeks/months away. Regardless, 2025 will likely be a tumultuous year for Small cap stocks
Simple speak
Analysts seem to think it is a good time to buy IWM, with a Buy or Strong Buy rating.
AlgoChirp’s EW analysis suggests IWM has a massive downside potential (30-50% drop) and very little upside potential (5-7% rise) at these levels.
Chart #1 - Decades long pattern unfolding
TA speak - Elliott Wave analysis by AlgoChirp
From its inception, IWM has followed Elliott Wave guidelines to the T. Price high that was made in 2021 can be labelled as a Wave 5 top with high confidence given what has transpired since then, corrective wave pattern (A-B-C).
It seems this corrective pattern is now nearing the end of Wave B. If this count is correct then the next leg down will be a swift one in Wave C.
Red box in Chart #2 below is the length IWM price will likely traverse. It can always be lesser in magnitude but a 30%-50% drop is likely on the cards. It is important to note that this Wave will take its own time to play out with various ups and downs.
Alternate count (Chart #2) - Incase the current perceived Wave B breaks through above the red lines in Chart #2, then the current count described above would invalidate and we will need to reassess the situation. However, at this point, this alternate count is of low probability.
Chart #2 - 2025 will bring trouble for smallcaps
Analyst Rating vs EW count
Analyst rating suggests bullish outlook for IWM on a Monthly timeframe. EW projection however is for the price to make significant lows
Analyst rating is “not In sync” with EW count


